

Answered step by step
Verified Expert Solution
Question
1 Approved Answer
Date Transaction Jan. 1 Inventory 10 Purchase 28 Sale 30 Feb. 5 10 16 28 Mar. 5 14 30 Sale Sale Jan. 1 Purchase Jan.
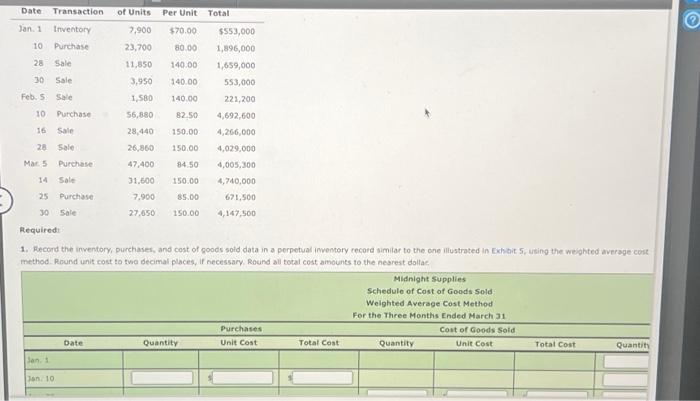
Date Transaction Jan. 1 Inventory 10 Purchase 28 Sale 30 Feb. 5 10 16 28 Mar. 5 14 30 Sale Sale Jan. 1 Purchase Jan. 10 Sale Sale 25 Purchase Purchase Sale Sale of Units Per Unit Total 7,900 $553,000 23,700 1,896,000 11,850 1,659,000 3,950 553,000 1,580 221,200 56,880 82.50 4,692,600 28,440 150.00 4,266,000 26,860 150.00 4,029,000 47,400 4,005,300 31,600 150.00 4,740,000 7,900 85.00 150.00 671,500 4,147,500 27,650 Date $70.00 80.00 140.00 140.00 Required: 1. Record the inventory, purchases, and cost of goods sold data in a perpetual inventory record similar to the one illustrated in Exhibit 5, using the weighted average cost method. Round unit cost to two decimal places, if necessary. Round all total cost amounts to the nearest dollar. 140.00 84.50 Quantity Purchases Unit Cost Total Cost Midnight Supplies Schedule of Cost of Goods Sold Weighted Average Cost Method For the Three Months Ended March 31 Cost of Goods Sold Unit Cost Quantity Total Cost Quantity
Step by Step Solution
There are 3 Steps involved in it
Step: 1

Get Instant Access to Expert-Tailored Solutions
See step-by-step solutions with expert insights and AI powered tools for academic success
Step: 2

Step: 3
Ace Your Homework with AI
Get the answers you need in no time with our AI-driven, step-by-step assistance
Get Started
Managerial Accounting And Analysis In Multinational Enterprises
Authors: H. Peter Holzer, Hanns Martin W. Schoenfeld
1st Edition
0899250874, 978-0899250878