

Question
Students will investigate the linear relationships between the price (in dollars) of Lego sets (the response) and possible numerical explanatory variables. Explanatory Variables: pieces: This
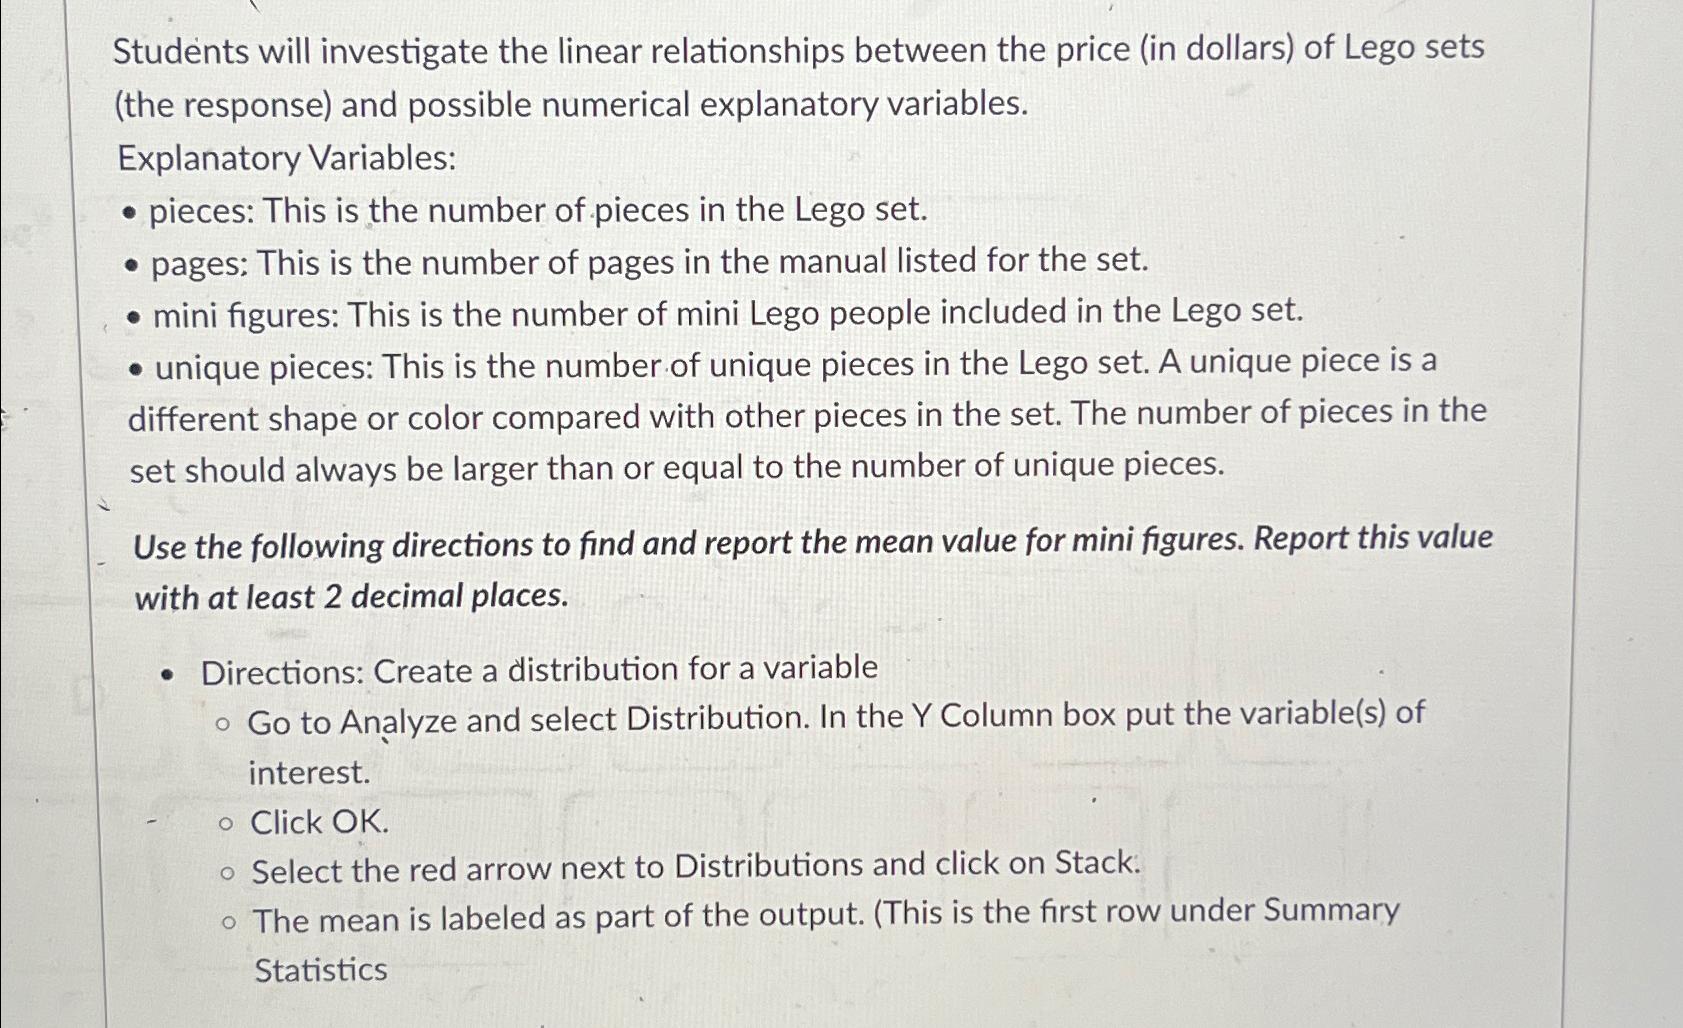
Students will investigate the linear relationships between the price (in dollars) of Lego sets (the response) and possible numerical explanatory variables.\ Explanatory Variables:\ pieces: This is the number of pieces in the Lego set.\ pages: This is the number of pages in the manual listed for the set.\ mini figures: This is the number of mini Lego people included in the Lego set.\ unique pieces: This is the number of unique pieces in the Lego set. A unique piece is a different shape or color compared with other pieces in the set. The number of pieces in the set should always be larger than or equal to the number of unique pieces.\ Use the following directions to find and report the mean value for mini figures. Report this value with at least 2 decimal places.\ Directions: Create a distribution for a variable\ Go to Analyze and select Distribution. In the Y Column box put the variable(s) of interest.\ Click OK.\ Select the red arrow next to Distributions and click on Stack.\ The mean is labeled as part of the output. (This is the first row under Summary Statistics
Step by Step Solution
There are 3 Steps involved in it
Step: 1

Get Instant Access to Expert-Tailored Solutions
See step-by-step solutions with expert insights and AI powered tools for academic success
Step: 2

Step: 3
Ace Your Homework with AI
Get the answers you need in no time with our AI-driven, step-by-step assistance
Get Started
Short Term Financial Management
Authors: Terry S. Maness, John T. Zietlow
3rd Edition
0324202938, 978-0324202939