Define the topics below and identify a best practice for valuation analysis and how it applies to the Whole Foods valuation.
- Terminal Value Estimation Method: Perpetual Growth vs. Market Multiple
- Cost of Capital Estimation: Firm WACC vs. Comparable Firm Benchmark
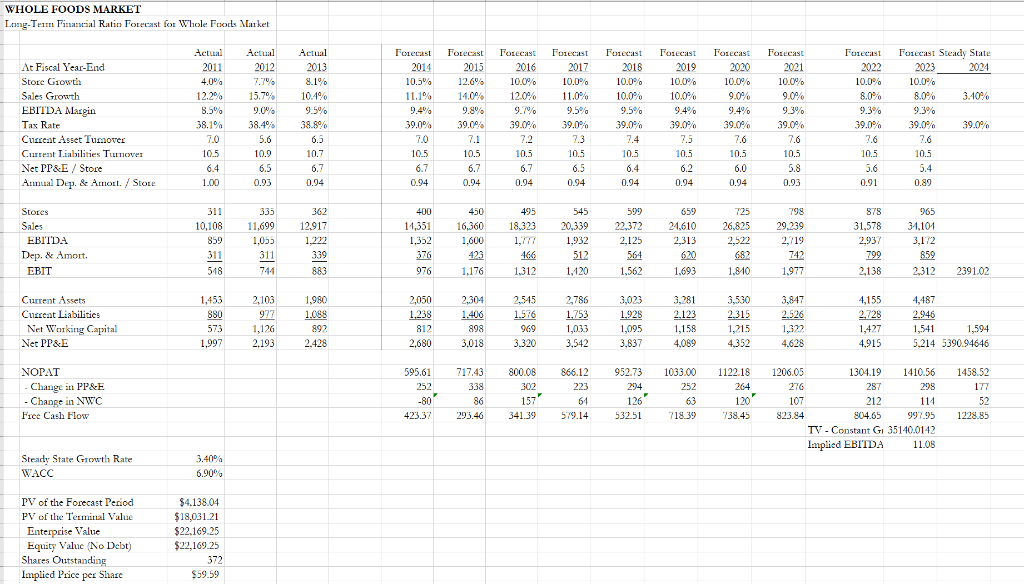
WHOLE FOODS MARKET Long-Tein Financial Ratio Forecast for Whole Foods Market Forecast 2016 10.0% 12.0% 9.7% Actual 2013 8.1% 10.4% 9.5% 38.8% Forecast 2019 10.0% 10.0% 9.4% At Fiscal Year-End Store Growth Sales Growth EBITDA Margin Tax Rate Current Asset Tumover Current Liabilities Turnover Net PP&E / Store Annual Dep. & Amort / Store Actual 2011 4.0% 12.2% 8.5% 38.1% 7.0 10.5 6.4 1.00 Forecast 2014 10.5% 11.1% 9.4% 39,0% 7.0 10.5 6.7 0.94 Forecast 2022 10.0% 8.0% 9.3% 2012 7.70 15.7 9.0% 38.494 5.6 10.9 6.5 0.93 Forecast 2015 12.6% 14.0% 9.8% 39.0% 7.1 10.5 6.7 0.94 Forecast 2017 10.0% 11.0% 9.5% 39.0% 7.3 10.5 6.5 0.94 Forecast 2018 10.0% 10.0% 9.5% 39.0% 7.4 10.5 6.4 0.94 Forecast 2020 10.0% 9.0% 9.4% 39.0% 7.6 10.5 6,0 Forecast 2021 10.0% 9.09% 9.3% 39.0% 7.6 10.5 5.8 0.93 Forecast Steady State 2023 2024 10.0% 8.0% 3.40% 9.3% 39.0% 39.0% 7.6 10.5 5.4 0.89 6.5 10.7 6.7 0.94 7.2 10.5 6.7 0.94 10.5 6.2 0.94 7.6 10.5 5.6 0.91 0.94 311 Stores Sales EBITDA Dep. & Amort. EBIT 10.108 859 335 11,699 1,055 311 362 12,917 1,222 339 400 11,351 1,352 376 976 450 16,360 1,600 423 495 18.323 1,777 466 545 20,339 1,932 512 1.120 599 22,372 2,125 564 1,562 659 24,610 2,313 725 26,825 2,522 682 798 29.239 2,719 742 1.977 199****** ***** **** *** 878 31,578 2,937 799 2,138 965 34,101 3,172 859 2,312 311 518 883 1,176 1,312 1,693 1,810 2391.02 Current Assets Current Liabilities Net Working Capital Net PP&E 1,453 880 573 1,997 2,103 977 1,126 2.193 1,980 1.088 892 2.428 2,050 1.238 812 2.680 2,304 1.406 898 3.018 2,545 1.576 969 3.320 2,786 1,753 1,0.3.3 3,023 1.926 1,095 3,837 3,281 2.123 1,158 4.089 3,530 2315 1,215 4.352 3,847 2.526 1,322 4.628 4,155 2.728 1,427 4,915 4,487 2.946 1,541 1,594 5.214 5390.94646 3,542 866.12 223 1033.00 252 NOPAT Change in PP&E - Change in NWC Free Cash Flow 595.61 252 -801 423.37 717.43 338 86 293.46 800.08 302 1571 34139 952.73 294 126 532.51 1122.18 264 120 738.45 1206.05 1304.19 1410.56 276 287 298 107 212 114 823.84 804.65 997.95 TV - Constant G 35140.0142 Implied EBITDA 11.08 1458.52 177 52 1228.85 61 579.14 718.39 Steady State Growth Rate WACC 3.40% 6.90% PV of the Forecast Period PV of the Terminal Value Enterprise Value Equity Value No Debt) Shares Outstanding Implied Price per Share $4.138.04 $18,031.21 $22.169.25 $22,169.25 372 $59.59 WHOLE FOODS MARKET Long-Tein Financial Ratio Forecast for Whole Foods Market Forecast 2016 10.0% 12.0% 9.7% Actual 2013 8.1% 10.4% 9.5% 38.8% Forecast 2019 10.0% 10.0% 9.4% At Fiscal Year-End Store Growth Sales Growth EBITDA Margin Tax Rate Current Asset Tumover Current Liabilities Turnover Net PP&E / Store Annual Dep. & Amort / Store Actual 2011 4.0% 12.2% 8.5% 38.1% 7.0 10.5 6.4 1.00 Forecast 2014 10.5% 11.1% 9.4% 39,0% 7.0 10.5 6.7 0.94 Forecast 2022 10.0% 8.0% 9.3% 2012 7.70 15.7 9.0% 38.494 5.6 10.9 6.5 0.93 Forecast 2015 12.6% 14.0% 9.8% 39.0% 7.1 10.5 6.7 0.94 Forecast 2017 10.0% 11.0% 9.5% 39.0% 7.3 10.5 6.5 0.94 Forecast 2018 10.0% 10.0% 9.5% 39.0% 7.4 10.5 6.4 0.94 Forecast 2020 10.0% 9.0% 9.4% 39.0% 7.6 10.5 6,0 Forecast 2021 10.0% 9.09% 9.3% 39.0% 7.6 10.5 5.8 0.93 Forecast Steady State 2023 2024 10.0% 8.0% 3.40% 9.3% 39.0% 39.0% 7.6 10.5 5.4 0.89 6.5 10.7 6.7 0.94 7.2 10.5 6.7 0.94 10.5 6.2 0.94 7.6 10.5 5.6 0.91 0.94 311 Stores Sales EBITDA Dep. & Amort. EBIT 10.108 859 335 11,699 1,055 311 362 12,917 1,222 339 400 11,351 1,352 376 976 450 16,360 1,600 423 495 18.323 1,777 466 545 20,339 1,932 512 1.120 599 22,372 2,125 564 1,562 659 24,610 2,313 725 26,825 2,522 682 798 29.239 2,719 742 1.977 199****** ***** **** *** 878 31,578 2,937 799 2,138 965 34,101 3,172 859 2,312 311 518 883 1,176 1,312 1,693 1,810 2391.02 Current Assets Current Liabilities Net Working Capital Net PP&E 1,453 880 573 1,997 2,103 977 1,126 2.193 1,980 1.088 892 2.428 2,050 1.238 812 2.680 2,304 1.406 898 3.018 2,545 1.576 969 3.320 2,786 1,753 1,0.3.3 3,023 1.926 1,095 3,837 3,281 2.123 1,158 4.089 3,530 2315 1,215 4.352 3,847 2.526 1,322 4.628 4,155 2.728 1,427 4,915 4,487 2.946 1,541 1,594 5.214 5390.94646 3,542 866.12 223 1033.00 252 NOPAT Change in PP&E - Change in NWC Free Cash Flow 595.61 252 -801 423.37 717.43 338 86 293.46 800.08 302 1571 34139 952.73 294 126 532.51 1122.18 264 120 738.45 1206.05 1304.19 1410.56 276 287 298 107 212 114 823.84 804.65 997.95 TV - Constant G 35140.0142 Implied EBITDA 11.08 1458.52 177 52 1228.85 61 579.14 718.39 Steady State Growth Rate WACC 3.40% 6.90% PV of the Forecast Period PV of the Terminal Value Enterprise Value Equity Value No Debt) Shares Outstanding Implied Price per Share $4.138.04 $18,031.21 $22.169.25 $22,169.25 372 $59.59