Answered step by step
Verified Expert Solution
Link Copied!

Question

1 Approved Answer

Derive a question that could be answered by data collection , See some examples below Collect data . You may obtain data sets from the
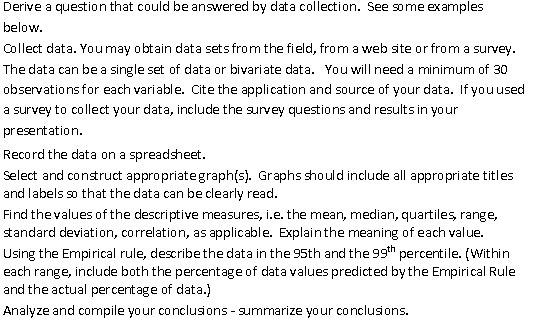
image text in transcribed
Derive a question that could be answered by data collection , See some examples below Collect data . You may obtain data sets from the field , from a web site or from a survey The data can be a single set of data or bivariate data . You will need a minimum of 30 observationsf or each variable , Cite the application and source of your data . If you used a survey I a collect your data , include the survey questions and results in your presentation Record the data on a spreadshee Select and construct appropriate graphis ) . Graphs should include all appropriate titles and labels so that the data can be clearly read Find the values of the descriptive measures , l e the mean , median , quartiles , range dard d standard deviation . correlation , as applicable . Explain the meaning of each value Using the Empirical rule , describe the data in the 95 th and the 95 " percentile . ( Within each range , include both the percentage of data values predicted by the Empirical Rule and the actual percentage of data . ) Analyze and compile your conclusions - summarize your conclusions ze and compile your conclusions - summarize your conclusions

Step by Step Solution

There are 3 Steps involved in it

Step: 1

blur-text-image

Get Instant Access to Expert-Tailored Solutions

See step-by-step solutions with expert insights and AI powered tools for academic success

Step: 2

blur-text-image_2

Step: 3

blur-text-image_3

Ace Your Homework with AI

Get the answers you need in no time with our AI-driven, step-by-step assistance

Get Started

Recommended Textbook for

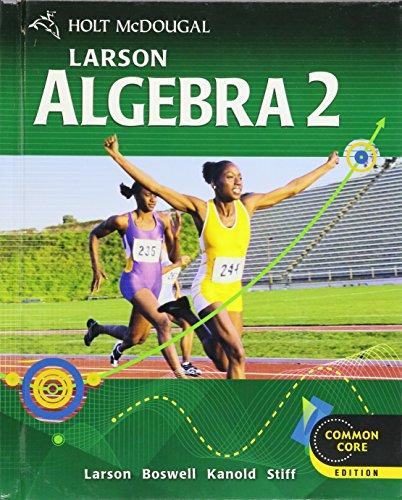
Holt Mcdougal Larson Algebra 2

Authors: HOLT MCDOUGAL

1st Edition 2012

9780547647159, 0547647158

More Books

Students also viewed these Mathematics questions