Question
Describe the companies Apple Inc. and Samsung Inc. what do they do, review the most recent annual report financial statements for both companies and answer
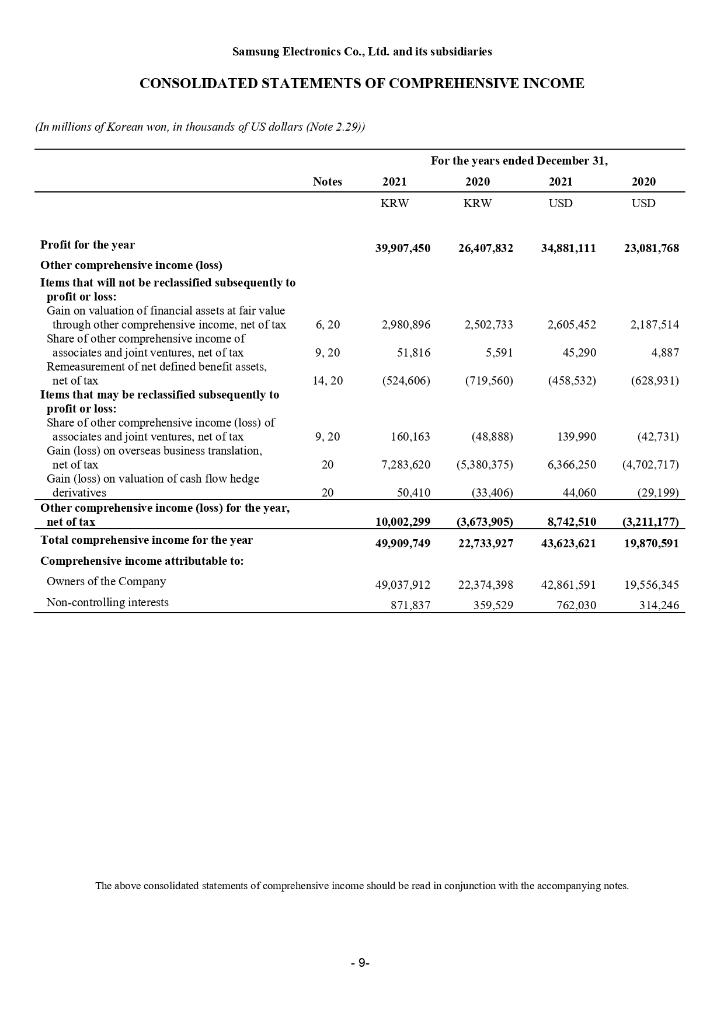
Describe the companies Apple Inc. and Samsung Inc. what do they do, review the most recent annual report financial statements for both companies and answer the following questions:
1.Comment on the liquidity of the Samsung and Apple Inc. companies. For which company is liquidity more important? Why?
2.For which company Samsung or Apple Inc are the management of current assets and current liabilities most important? Why? Which company has the largest investment in fixed assets? For both companies, what percentage of total assets are current and fixed? What is the implication of this analysis regarding the management of assets for the two companies?
3.How have Samsung and Apple Inc. financed the investment in assets? Are both companies able to cover their financing costs? What does this analysis imply about the profitability of the two companies?
4.How profitable are Samsung and Apple Inc. relative to total sales, assets, common equity, and share price? What do the price/earnings multiples for the two companies suggest about investors' attitudes toward the companies?
5.What does a DuPont Analysis suggest about the companies?
6.Any new project(s) would you propose? How should be they analyzed and evaluated in terms of potential return and risk? Provide comprehensive explanations based on studied materials of the course FIN342. XD
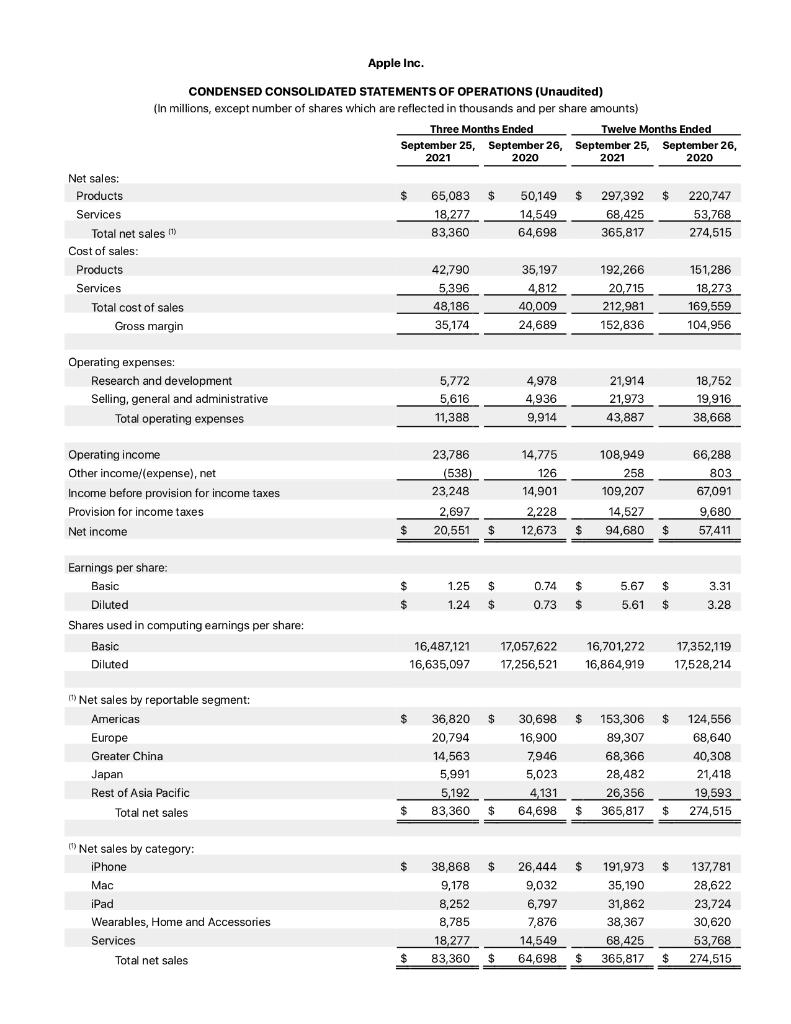
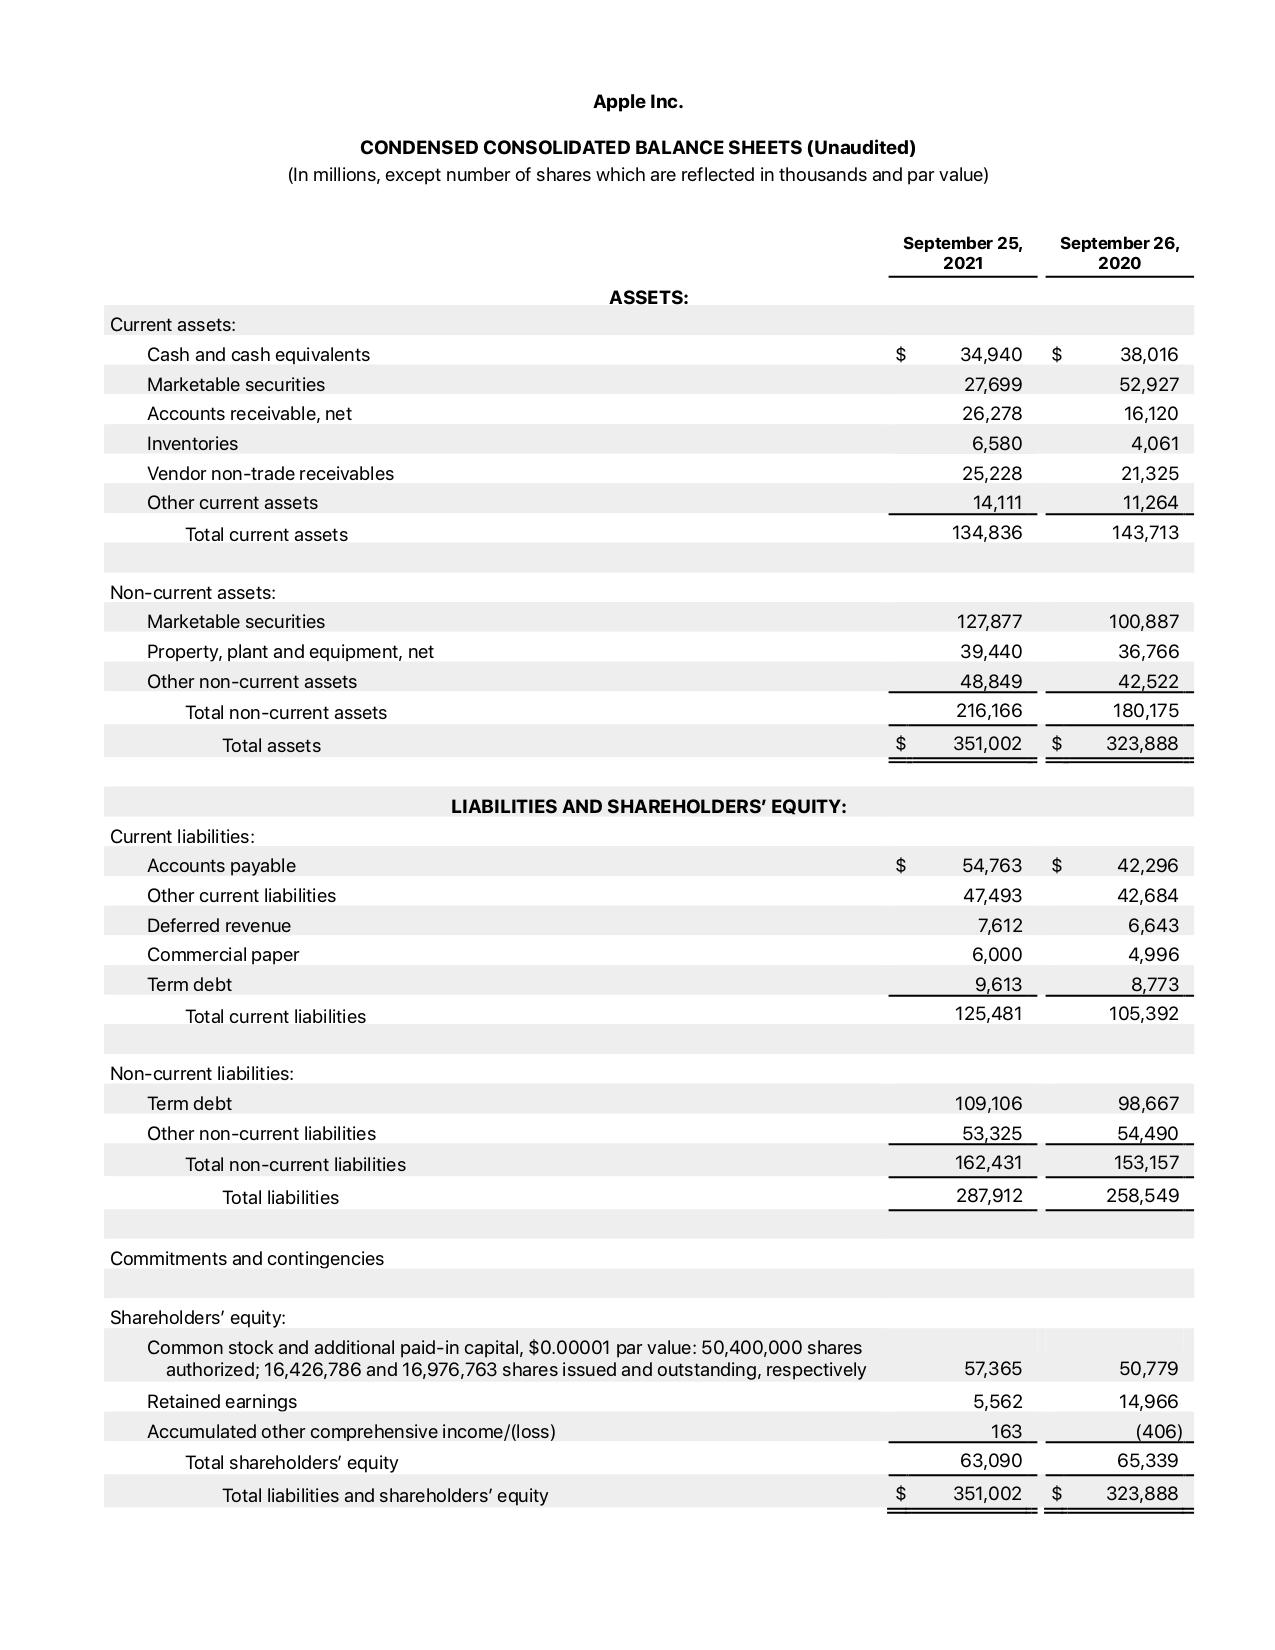
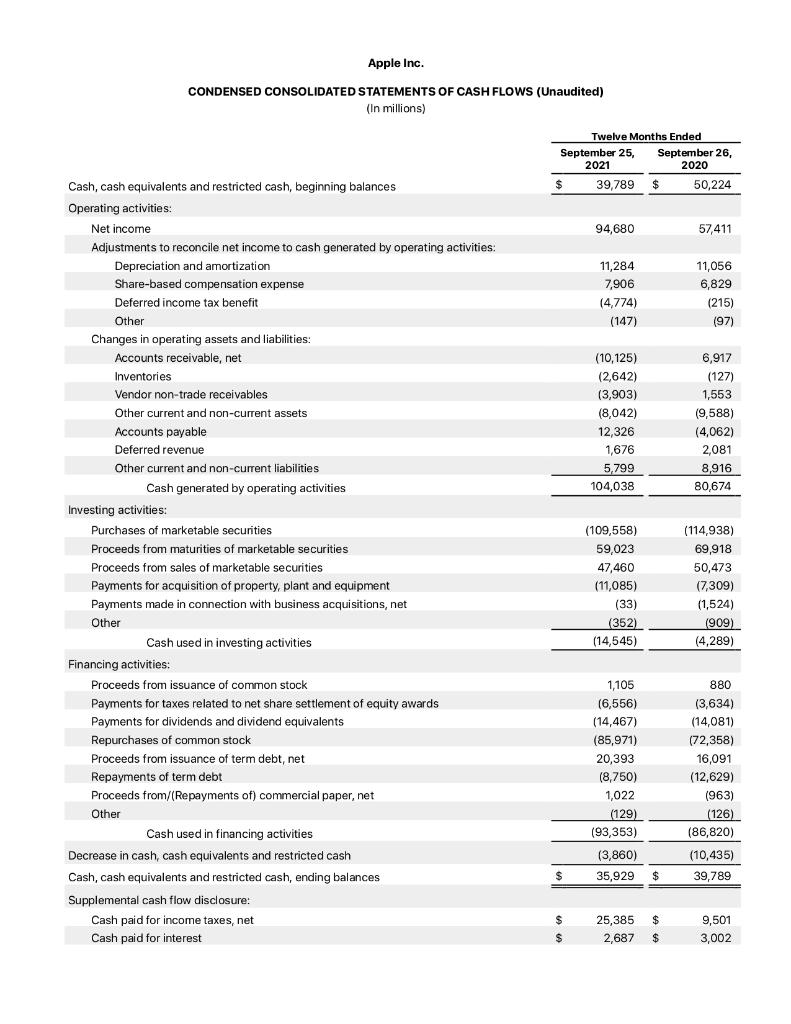
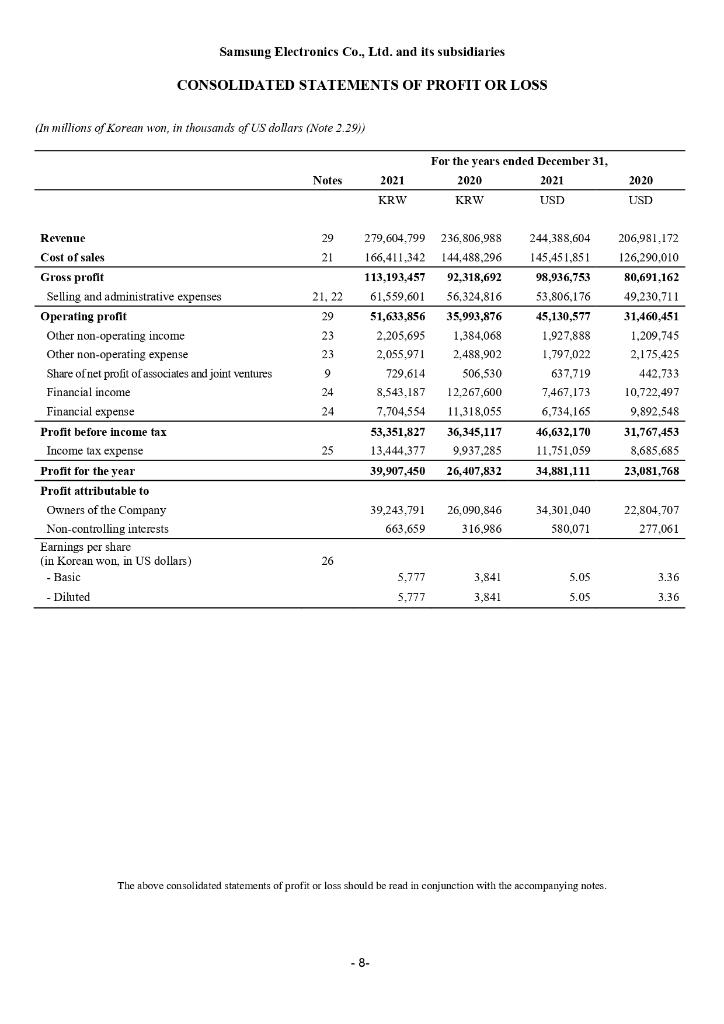
Apple Inc. CONDENSED CONSOLIDATED STATEMENTS OF OPERATIONS (Unaudited) (In millions, except number of shares which are reflected in thousands and per share amounts) Three Months Ended Twelve Months Ended September 25, September 26, September 25, September 26, 2021 2020 2021 2020 Net sales: Products $ 65,083 $ 50,149 $ 297,392 $ 220,747 Services 18,277 14,549 68,425 53,768 Total net sales (1) 83,360 64,698 365,817 274,515 Cost of sales: Products 42,790 35,197 192,266 151,286 Services 5,396 4,812 20,715 18,273 Total cost of sales 48,186 40,009 212,981 169,559 Gross margin 35174 24,689 152,836 104,956 Operating expenses: Research and development Selling, general and administrative Total operating expenses 5,772 5,616 11,388 4,978 4,936 21,914 21,973 43,887 18,752 19,916 38,668 9.914 23,786 (538) Operating income Other income/(expense), net Income before provision for income taxes Provision for income taxes Net income 23,248 2,697 20,551 14,775 108,949 126 258 14,901 109,207 2,228 14,527 12,673 $ 94,680 66,288 803 67,091 9,680 57,411 $ $ $ 1.25 $ 0.74 5.67 $ $ $ $ $ $ $ 3.31 3.28 1.24 $ 0.73 5.61 Earnings per share: Basic Diluted Shares used in computing eamings per share: Basic Diluted 16,487,121 16,635,097 17,057,622 17,256,521 16,701,272 16,864,919 17,352,119 17,528,214 $ $ $ $ Net sales by reportable segment: Americas Europe Greater China Japan Rest of Asia Pacific Total net sales 36,820 20,794 14,563 5,991 5,192 83,360 30,698 16,900 7,946 5,023 4,131 64,698 153,306 89,307 68,366 28,482 26,356 365,817 124,556 68,640 40,308 21,418 19,593 274,515 $ $ $ $ $ $ $ Net sales by category: iPhone Mac iPad Wearables, Home and Accessories Services Total net sales 38,868 9,178 8,252 8,785 18,277 83,360 26,444 $ 191,973 9,032 35,190 6,797 31,862 7,876 38,367 14,549 68,425 64,698 $ 137,781 28,622 23,724 30,620 53,768 274,515 $ $ 365,817 $ Apple Inc. CONDENSED CONSOLIDATED BALANCE SHEETS (Unaudited) (In millions, except number of shares which are reflected in thousands and par value) September 25, 2021 September 26, 2020 ASSETS: $ $ Current assets: Cash and cash equivalents Marketable securities Accounts receivable, net Inventories Vendor non-trade receivables Other current assets 34,940 27,699 26,278 6,580 25,228 14,111 134,836 38,016 52,927 16,120 4,061 21,325 11,264 143,713 Total current assets Non-current assets: Marketable securities Property, plant and equipment, net Other non-current assets Total non-current assets 127,877 39,440 48,849 216,166 351,002 100,887 36,766 42,522 180,175 323,888 Total assets $ $ LIABILITIES AND SHAREHOLDERS' EQUITY: $ $ Current liabilities: Accounts payable Other current liabilities Deferred revenue Commercial paper Term debt Total current liabilities 54,763 47,493 7,612 6,000 9,613 125,481 42,296 42,684 6,643 4,996 8,773 105,392 Non-current liabilities: Term debt Other non-current liabilities 109,106 53,325 162,431 287,912 98,667 54,490 153,157 258,549 Total non-current liabilities Total liabilities Commitments and contingencies Shareholders' equity: Common stock and additional paid-in capital, $0.00001 par value: 50,400,000 shares authorized; 16,426,786 and 16,976,763 shares issued and outstanding, respectively Retained earnings Accumulated other comprehensive income/(loss) Total shareholders' equity Total liabilities and shareholders' equity 57,365 5,562 163 63,090 351,002 50,779 14,966 (406) 65,339 323,888 $ $ Apple Inc. CONDENSED CONSOLIDATED STATEMENTS OF CASH FLOWS (Unaudited) (In millions) Twelve Months Ended September 25, September 26, 2021 2020 $ 39,789 $ 50,224 94,680 57,411 Cash, cash equivalents and restricted cash, beginning balances Operating activities: Net income Adjustments to reconcile net income to cash generated by operating activities: Depreciation and amortization Share-based compensation expense Deferred income tax benefit 11,284 7,906 (4,774) (147) 11,056 6,829 (215) (97) Other (10,125) (2,642) (3,903) (8,042) 12,326 1,676 5,799 104,038 6,917 (127) 1,553 (9,588) (4,062) 2,081 8,916 80,674 (109,558) 59,023 47,460 (11,085) (33) (352) (14,545) (114,938) 69,918 50,473 (7,309) Changes in operating assets and liabilities: Accounts receivable, net , Inventories Vendor non-trade receivables Other current and non-current assets Accounts payable Deferred revenue Other current and non-current liabilities Cash generated by operating activities Investing activities: Purchases of marketable securities Proceeds from maturities of marketable securities Proceeds from sales of marketable securities Payments for acquisition of property, plant and equipment Payments made in connection with business acquisitions, net Other Cash used in investing activities Financing activities: Proceeds from issuance of common stock Payments for taxes related to net share settlement of equity awards Payments for dividends and dividend equivalents Repurchases of common stock Proceeds from issuance of term debt, net Repayments of term debt Proceeds from/(Repayments of) commercial paper, net Other Cash used in financing activities Decrease in cash, cash equivalents and restricted cash Cash, cash equivalents and restricted cash, ending balances Supplemental cash flow disclosure: Cash paid for income taxes, net Cash paid for interest (1,524) (909) (4,289) 1,105 (6,556) (14,467) (85,971) 20,393 (8,750) 1,022 (129) (93,353) (3,860) 35,929 880 (3,634) (14,081) (72,358) 16,091 (12,629) (963) (126) (86,820) (10,435) 39,789 $ $ $ $ 25,385 $ 2,687 $ 9,501 3,002 $ Samsung Electronics Co., Ltd. and its subsidiaries CONSOLIDATED STATEMENTS OF PROFIT OR LOSS (In millions of Korean won, in thousands of US dollars (Note 2.29)) Notes 2021 KRW For the year's ended December 31, 2020 2021 KRW USD 2020 USD 29 244,388,604 145,451,851 21 279,604.799 166,411.342 113,193,457 61,559,601 21, 22 29 23 23 236.806,988 144,488.296 92,318,692 56,324.816 35,993,876 1,384,068 2.488,902 506,530 12,267,600 11,318,055 9 51,633,856 2.205.695 2,055,971 729,614 8,543,187 7.704,554 53,351,827 13,444.377 39,907,450 Revenue Cost of sales Gross profit Selling and administrative expenses Operating profit Other non-operating income Other non-operating expense Share of niet profit of associates and joint ventures Financial income Financial expense Profit before income tax Income tax expense Profit for the year Profit attributable to Owners of the Company Non-controlling interests Earnings per share (in Korean won, in US dollars) - Basic - Diluted 206,981,172 126,290.010 80,691,162 49,230,711 31,460,451 1.209.745 2,175,425 442.733 10,722,497 9,892,548 31,767,453 8,685,685 23,081,768 98,936,753 53,806,176 45,130,577 1,927.888 1,797,022 637,719 7,467,173 6,734,165 46,632,170 11,751,059 34,881,111 24 24 25 36,345,117 9.937.285 26.407,832 39,243.791 663,659 26,090,846 316,986 34,301,040 580.071 22,804.707 277,061 26 3,841 5.05 3.36 5.777 5,777 3,841 5.05 3.36 The above consolidated statements of profit or loss should be read in conjunction with the accompanying notes. - 8- Samsung Electronics Co., Ltd. and its subsidiaries CONSOLIDATED STATEMENTS OF COMPREHENSIVE INCOME (In millions of Korean won, in thousands of US dollars (Note 2.29)) For the years ended December 31, 2020 2021 Notes 2021 2020 KRW KRW USD USD 39,907,450 26,407,832 34,881,111 23,081,768 6, 20 2,980,896 2,502,733 2,605,452 2,187,514 9,20 51,816 5,591 45.290 4,887 14,20 (524,606) (719.560) (458,532) (628,931) Profit for the year Other comprehensive income (loss) Items that will not be reclassified subsequently to profit or loss: Gain on valuation of financial assets at fair value through other comprehensive income, net of tax Share of other comprehensive income of associates and joint ventures, net of tax Remeasurement of net defined benefit assets, nel of tax Items that may be reclassified subsequently to profit or loss: Share of other comprehensive income (loss) of associates and joint ventures, nel of tax Gain (loss) on overseas business translation, nel of tax Gain (loss) on valuation of cash flow hedge derivatives Other comprehensive income (loss) for the year, net of tax Total comprehensive income for the year Comprehensive income attributable to: Owners of the Company Non-controlling interests 9. 20 160,163 (48,888) 139.990 (42.731) 20 7.283,620 (5,380,375) 6,366.250 (4,702,717) 20 50.410 (33,406) 44,060 (29,199) 10,002,299 (3,673,905) 8.742.510 (3,211,177) 49,909,749 22.733.927 43,623,621 19,870,591 49,037.912 22,374,398 42.861.591 19,556.345 871,837 359,529 762.030 314.246 The above consolidated statements of comprehensive income should be read in conjunction with the accompanying notes. -9- Apple Inc. CONDENSED CONSOLIDATED STATEMENTS OF OPERATIONS (Unaudited) (In millions, except number of shares which are reflected in thousands and per share amounts) Three Months Ended Twelve Months Ended September 25, September 26, September 25, September 26, 2021 2020 2021 2020 Net sales: Products $ 65,083 $ 50,149 $ 297,392 $ 220,747 Services 18,277 14,549 68,425 53,768 Total net sales (1) 83,360 64,698 365,817 274,515 Cost of sales: Products 42,790 35,197 192,266 151,286 Services 5,396 4,812 20,715 18,273 Total cost of sales 48,186 40,009 212,981 169,559 Gross margin 35174 24,689 152,836 104,956 Operating expenses: Research and development Selling, general and administrative Total operating expenses 5,772 5,616 11,388 4,978 4,936 21,914 21,973 43,887 18,752 19,916 38,668 9.914 23,786 (538) Operating income Other income/(expense), net Income before provision for income taxes Provision for income taxes Net income 23,248 2,697 20,551 14,775 108,949 126 258 14,901 109,207 2,228 14,527 12,673 $ 94,680 66,288 803 67,091 9,680 57,411 $ $ $ 1.25 $ 0.74 5.67 $ $ $ $ $ $ $ 3.31 3.28 1.24 $ 0.73 5.61 Earnings per share: Basic Diluted Shares used in computing eamings per share: Basic Diluted 16,487,121 16,635,097 17,057,622 17,256,521 16,701,272 16,864,919 17,352,119 17,528,214 $ $ $ $ Net sales by reportable segment: Americas Europe Greater China Japan Rest of Asia Pacific Total net sales 36,820 20,794 14,563 5,991 5,192 83,360 30,698 16,900 7,946 5,023 4,131 64,698 153,306 89,307 68,366 28,482 26,356 365,817 124,556 68,640 40,308 21,418 19,593 274,515 $ $ $ $ $ $ $ Net sales by category: iPhone Mac iPad Wearables, Home and Accessories Services Total net sales 38,868 9,178 8,252 8,785 18,277 83,360 26,444 $ 191,973 9,032 35,190 6,797 31,862 7,876 38,367 14,549 68,425 64,698 $ 137,781 28,622 23,724 30,620 53,768 274,515 $ $ 365,817 $ Apple Inc. CONDENSED CONSOLIDATED BALANCE SHEETS (Unaudited) (In millions, except number of shares which are reflected in thousands and par value) September 25, 2021 September 26, 2020 ASSETS: $ $ Current assets: Cash and cash equivalents Marketable securities Accounts receivable, net Inventories Vendor non-trade receivables Other current assets 34,940 27,699 26,278 6,580 25,228 14,111 134,836 38,016 52,927 16,120 4,061 21,325 11,264 143,713 Total current assets Non-current assets: Marketable securities Property, plant and equipment, net Other non-current assets Total non-current assets 127,877 39,440 48,849 216,166 351,002 100,887 36,766 42,522 180,175 323,888 Total assets $ $ LIABILITIES AND SHAREHOLDERS' EQUITY: $ $ Current liabilities: Accounts payable Other current liabilities Deferred revenue Commercial paper Term debt Total current liabilities 54,763 47,493 7,612 6,000 9,613 125,481 42,296 42,684 6,643 4,996 8,773 105,392 Non-current liabilities: Term debt Other non-current liabilities 109,106 53,325 162,431 287,912 98,667 54,490 153,157 258,549 Total non-current liabilities Total liabilities Commitments and contingencies Shareholders' equity: Common stock and additional paid-in capital, $0.00001 par value: 50,400,000 shares authorized; 16,426,786 and 16,976,763 shares issued and outstanding, respectively Retained earnings Accumulated other comprehensive income/(loss) Total shareholders' equity Total liabilities and shareholders' equity 57,365 5,562 163 63,090 351,002 50,779 14,966 (406) 65,339 323,888 $ $ Apple Inc. CONDENSED CONSOLIDATED STATEMENTS OF CASH FLOWS (Unaudited) (In millions) Twelve Months Ended September 25, September 26, 2021 2020 $ 39,789 $ 50,224 94,680 57,411 Cash, cash equivalents and restricted cash, beginning balances Operating activities: Net income Adjustments to reconcile net income to cash generated by operating activities: Depreciation and amortization Share-based compensation expense Deferred income tax benefit 11,284 7,906 (4,774) (147) 11,056 6,829 (215) (97) Other (10,125) (2,642) (3,903) (8,042) 12,326 1,676 5,799 104,038 6,917 (127) 1,553 (9,588) (4,062) 2,081 8,916 80,674 (109,558) 59,023 47,460 (11,085) (33) (352) (14,545) (114,938) 69,918 50,473 (7,309) Changes in operating assets and liabilities: Accounts receivable, net , Inventories Vendor non-trade receivables Other current and non-current assets Accounts payable Deferred revenue Other current and non-current liabilities Cash generated by operating activities Investing activities: Purchases of marketable securities Proceeds from maturities of marketable securities Proceeds from sales of marketable securities Payments for acquisition of property, plant and equipment Payments made in connection with business acquisitions, net Other Cash used in investing activities Financing activities: Proceeds from issuance of common stock Payments for taxes related to net share settlement of equity awards Payments for dividends and dividend equivalents Repurchases of common stock Proceeds from issuance of term debt, net Repayments of term debt Proceeds from/(Repayments of) commercial paper, net Other Cash used in financing activities Decrease in cash, cash equivalents and restricted cash Cash, cash equivalents and restricted cash, ending balances Supplemental cash flow disclosure: Cash paid for income taxes, net Cash paid for interest (1,524) (909) (4,289) 1,105 (6,556) (14,467) (85,971) 20,393 (8,750) 1,022 (129) (93,353) (3,860) 35,929 880 (3,634) (14,081) (72,358) 16,091 (12,629) (963) (126) (86,820) (10,435) 39,789 $ $ $ $ 25,385 $ 2,687 $ 9,501 3,002 $ Samsung Electronics Co., Ltd. and its subsidiaries CONSOLIDATED STATEMENTS OF PROFIT OR LOSS (In millions of Korean won, in thousands of US dollars (Note 2.29)) Notes 2021 KRW For the year's ended December 31, 2020 2021 KRW USD 2020 USD 29 244,388,604 145,451,851 21 279,604.799 166,411.342 113,193,457 61,559,601 21, 22 29 23 23 236.806,988 144,488.296 92,318,692 56,324.816 35,993,876 1,384,068 2.488,902 506,530 12,267,600 11,318,055 9 51,633,856 2.205.695 2,055,971 729,614 8,543,187 7.704,554 53,351,827 13,444.377 39,907,450 Revenue Cost of sales Gross profit Selling and administrative expenses Operating profit Other non-operating income Other non-operating expense Share of niet profit of associates and joint ventures Financial income Financial expense Profit before income tax Income tax expense Profit for the year Profit attributable to Owners of the Company Non-controlling interests Earnings per share (in Korean won, in US dollars) - Basic - Diluted 206,981,172 126,290.010 80,691,162 49,230,711 31,460,451 1.209.745 2,175,425 442.733 10,722,497 9,892,548 31,767,453 8,685,685 23,081,768 98,936,753 53,806,176 45,130,577 1,927.888 1,797,022 637,719 7,467,173 6,734,165 46,632,170 11,751,059 34,881,111 24 24 25 36,345,117 9.937.285 26.407,832 39,243.791 663,659 26,090,846 316,986 34,301,040 580.071 22,804.707 277,061 26 3,841 5.05 3.36 5.777 5,777 3,841 5.05 3.36 The above consolidated statements of profit or loss should be read in conjunction with the accompanying notes. - 8- Samsung Electronics Co., Ltd. and its subsidiaries CONSOLIDATED STATEMENTS OF COMPREHENSIVE INCOME (In millions of Korean won, in thousands of US dollars (Note 2.29)) For the years ended December 31, 2020 2021 Notes 2021 2020 KRW KRW USD USD 39,907,450 26,407,832 34,881,111 23,081,768 6, 20 2,980,896 2,502,733 2,605,452 2,187,514 9,20 51,816 5,591 45.290 4,887 14,20 (524,606) (719.560) (458,532) (628,931) Profit for the year Other comprehensive income (loss) Items that will not be reclassified subsequently to profit or loss: Gain on valuation of financial assets at fair value through other comprehensive income, net of tax Share of other comprehensive income of associates and joint ventures, net of tax Remeasurement of net defined benefit assets, nel of tax Items that may be reclassified subsequently to profit or loss: Share of other comprehensive income (loss) of associates and joint ventures, nel of tax Gain (loss) on overseas business translation, nel of tax Gain (loss) on valuation of cash flow hedge derivatives Other comprehensive income (loss) for the year, net of tax Total comprehensive income for the year Comprehensive income attributable to: Owners of the Company Non-controlling interests 9. 20 160,163 (48,888) 139.990 (42.731) 20 7.283,620 (5,380,375) 6,366.250 (4,702,717) 20 50.410 (33,406) 44,060 (29,199) 10,002,299 (3,673,905) 8.742.510 (3,211,177) 49,909,749 22.733.927 43,623,621 19,870,591 49,037.912 22,374,398 42.861.591 19,556.345 871,837 359,529 762.030 314.246 The above consolidated statements of comprehensive income should be read in conjunction with the accompanying notes. -9Step by Step Solution
There are 3 Steps involved in it
Step: 1

Get Instant Access to Expert-Tailored Solutions
See step-by-step solutions with expert insights and AI powered tools for academic success
Step: 2

Step: 3

Ace Your Homework with AI
Get the answers you need in no time with our AI-driven, step-by-step assistance
Get Started


