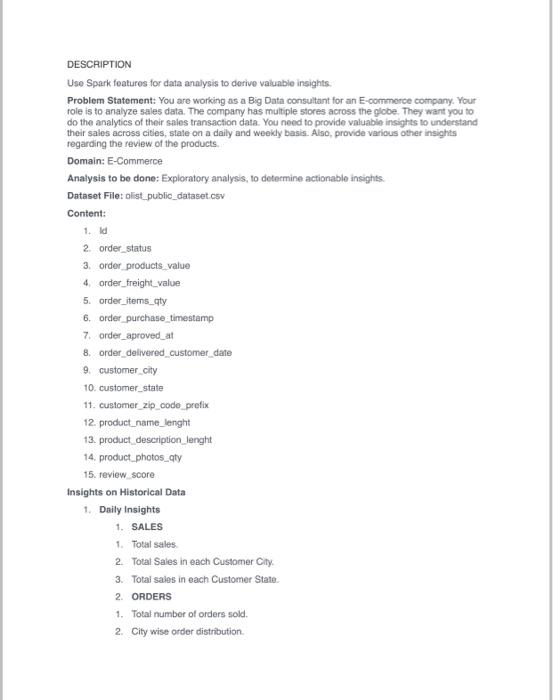
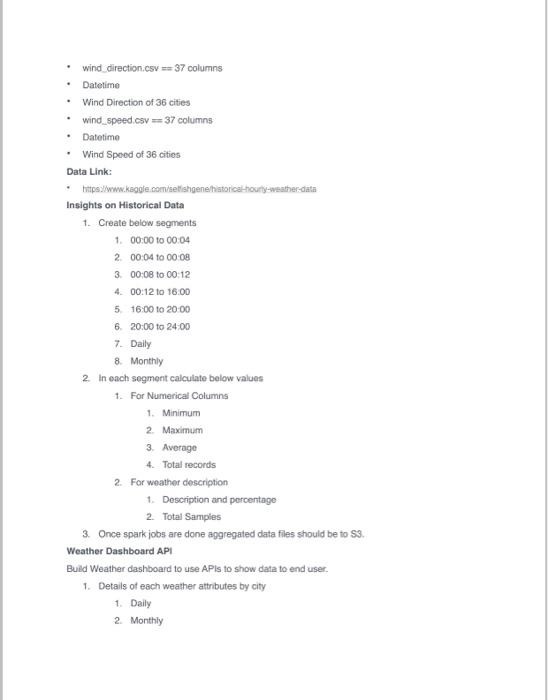
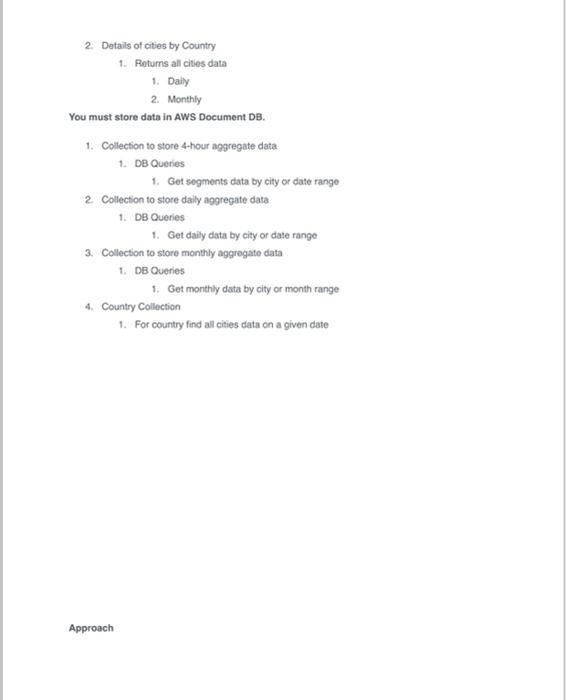
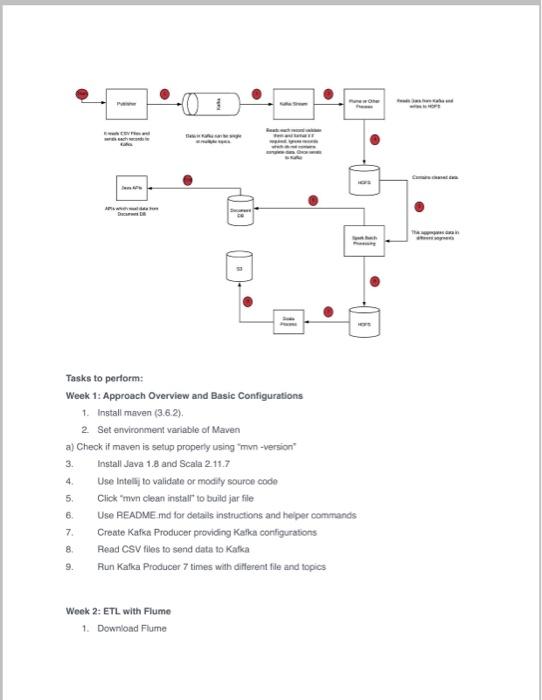
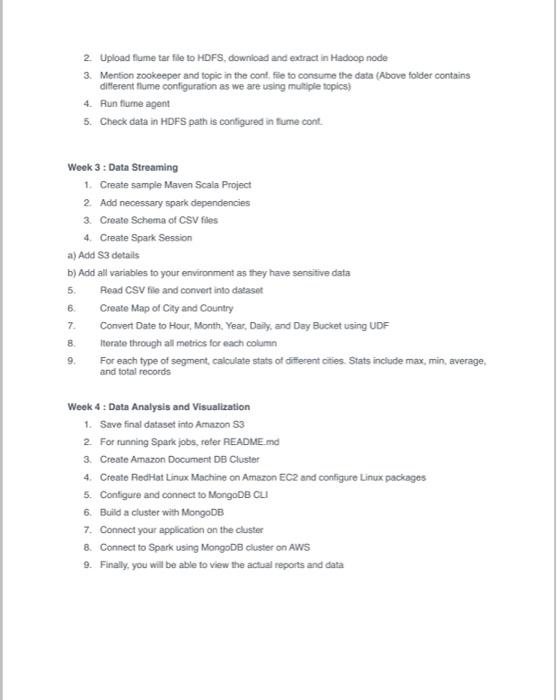
DESCRIPTION Use Spark features for data analysis to derive valuable insights Problem Statement: You are working as a Big Data consultant for an E-commerce company. Your role is to analyze sales data. The company has multiple stores across the globe. They want you to do the analytics of their sales transaction data. You need to provide valuable insights to understand their sales across cities, state on a daily and weekly basis. Also, provide various other insights regarding the review of the products, Domain: E-Commerce Analysis to be done: Exploratory analysis, to determine actionable insights Dataset File: olist_public_dataset.csv Content: 1. ld 2. order_status 3. order products value 4. order_freight_value 5. order_items_qty 6. Order_purchase_timestamp 7. order_aproved_at 8. order_delivered_customer_date 9. customer_city 10. customer_state 11. customer_zip_code prefix 12. product_name_lenght 13. product_description_lenght 14. product_photos_qty 15. review score Insights on Historical Data 1. Daily Insights 1. SALES 1. Total sales 2. Total Sales in each Customer City 3. Total sales in each Customer State 2. ORDERS 1. Total number of orders sold. 2. City wise order distribution wind direction.csv - 37 columns Datetime Wind Direction of 36 cities wind_speed.csv == 37 columns Datetime Wind Speed of 36 cities Data Link: https://www.kaggle.com/setishgenhetorichoul-weather data Insights on Historical Data 1. Create below segments 1. 00:00 to 00:04 2. 00:04 to 00 08 3. 00:08 to 00:12 4. 00:12 to 16:00 5 16:00 to 20:00 6. 20:00 to 24.00 7. Daily 8. Monthly 2 In each segment calculate below values 1. For Numerical Columns 1. Minimum 2. Maximum 3. Average 4. Total records 2. For weather description 1. Description and percentage 2. Total Samples 3. Once spark jobs are done aggregated data files should be to S3. Weather Dashboard API Build Weather dashboard to use APIs to show data to end user 1. Details of each weather attributes by city 1. Daily 2 Monthly 2 Details of cities by Country 1. Returns all cities data 1. Daily 2. Monthly You must store data in AWS Document DB. 1. Collection to store 4-hour aggregate data 1. DB Queries 1. Get segments data by city or date range 2 Collection to store daily aggregate data 1. DB Queries 1. Get daily data by city or date range 3. Collection to store monthly aggregate data 1. DB Queries 1. Get monthly data by city or month range 4. Country Collection 1. For country find all cities data on a given date Approach wa 1 Tasks to perform Week 1: Approach Overview and Basic Configurations 1. Install maven (3.6.2). 2 Set environment variable of Maven a) Check if maven is setup properly using mvn -version 3. Install Java 1.8 and Scala 211.7 Use Intellij to validate or modify source code Click "mwn clean install to build jar file Use README.md for details instructions and helper commands Create Kafkat Producer providing Kafica configurations 8 Read CSV files to send data to Katka Run Kafka Producer 7 times with different file and topics 4. 5 6 7 9. Week 2: ETL with Flume 1. Download Fiume 2 Upload flume tar file to HDFS, download and extract in Hadoop node 3. Mention Zookeeper and topic in the cont, file to consume the data (Above folder contains different lume configuration as we are using multiple topics) 4. Run fume agent 5. Check data in HDFS path is configured in fume cont Week 3 : Data Streaming 1. Create sample Maven Scala Project 2. Add necessary spark dependencies 3. Create Schema of CSV files 4. Create Spark Session a) Add S3 details b) Add all variables to your environment as they have sensitive data Read CSV file and convert into dataset Create Map of City and Country 7. Convert Date to Hour, Month. Year, Daily, and Day Bucket using UDF 8 Iterate through all metrics for each column For each type of segment, calculate stats of different cities. Stats include max, min average, and total records 5. 6 9 Week 4 : Data Analysis and Visualization 1. Save final dataset into Amazon S3 2 For running Spark jobs, refer README.md 3. Create Amazon Document de Cluster 4. Create RedHat Linux Machine on Amazon EC2 and configure Linux packages 5. Configure and connect to MongoDB CUI 6. Build a cluster with MongoDB 7. Connect your appication on the cluster 8. Connect to Spark using MongoDB cluster on AWS 2. Finally, you will be able to view the actual reports and data DESCRIPTION Use Spark features for data analysis to derive valuable insights Problem Statement: You are working as a Big Data consultant for an E-commerce company. Your role is to analyze sales data. The company has multiple stores across the globe. They want you to do the analytics of their sales transaction data. You need to provide valuable insights to understand their sales across cities, state on a daily and weekly basis. Also, provide various other insights regarding the review of the products, Domain: E-Commerce Analysis to be done: Exploratory analysis, to determine actionable insights Dataset File: olist_public_dataset.csv Content: 1. ld 2. order_status 3. order products value 4. order_freight_value 5. order_items_qty 6. Order_purchase_timestamp 7. order_aproved_at 8. order_delivered_customer_date 9. customer_city 10. customer_state 11. customer_zip_code prefix 12. product_name_lenght 13. product_description_lenght 14. product_photos_qty 15. review score Insights on Historical Data 1. Daily Insights 1. SALES 1. Total sales 2. Total Sales in each Customer City 3. Total sales in each Customer State 2. ORDERS 1. Total number of orders sold. 2. City wise order distribution wind direction.csv - 37 columns Datetime Wind Direction of 36 cities wind_speed.csv == 37 columns Datetime Wind Speed of 36 cities Data Link: https://www.kaggle.com/setishgenhetorichoul-weather data Insights on Historical Data 1. Create below segments 1. 00:00 to 00:04 2. 00:04 to 00 08 3. 00:08 to 00:12 4. 00:12 to 16:00 5 16:00 to 20:00 6. 20:00 to 24.00 7. Daily 8. Monthly 2 In each segment calculate below values 1. For Numerical Columns 1. Minimum 2. Maximum 3. Average 4. Total records 2. For weather description 1. Description and percentage 2. Total Samples 3. Once spark jobs are done aggregated data files should be to S3. Weather Dashboard API Build Weather dashboard to use APIs to show data to end user 1. Details of each weather attributes by city 1. Daily 2 Monthly 2 Details of cities by Country 1. Returns all cities data 1. Daily 2. Monthly You must store data in AWS Document DB. 1. Collection to store 4-hour aggregate data 1. DB Queries 1. Get segments data by city or date range 2 Collection to store daily aggregate data 1. DB Queries 1. Get daily data by city or date range 3. Collection to store monthly aggregate data 1. DB Queries 1. Get monthly data by city or month range 4. Country Collection 1. For country find all cities data on a given date Approach wa 1 Tasks to perform Week 1: Approach Overview and Basic Configurations 1. Install maven (3.6.2). 2 Set environment variable of Maven a) Check if maven is setup properly using mvn -version 3. Install Java 1.8 and Scala 211.7 Use Intellij to validate or modify source code Click "mwn clean install to build jar file Use README.md for details instructions and helper commands Create Kafkat Producer providing Kafica configurations 8 Read CSV files to send data to Katka Run Kafka Producer 7 times with different file and topics 4. 5 6 7 9. Week 2: ETL with Flume 1. Download Fiume 2 Upload flume tar file to HDFS, download and extract in Hadoop node 3. Mention Zookeeper and topic in the cont, file to consume the data (Above folder contains different lume configuration as we are using multiple topics) 4. Run fume agent 5. Check data in HDFS path is configured in fume cont Week 3 : Data Streaming 1. Create sample Maven Scala Project 2. Add necessary spark dependencies 3. Create Schema of CSV files 4. Create Spark Session a) Add S3 details b) Add all variables to your environment as they have sensitive data Read CSV file and convert into dataset Create Map of City and Country 7. Convert Date to Hour, Month. Year, Daily, and Day Bucket using UDF 8 Iterate through all metrics for each column For each type of segment, calculate stats of different cities. Stats include max, min average, and total records 5. 6 9 Week 4 : Data Analysis and Visualization 1. Save final dataset into Amazon S3 2 For running Spark jobs, refer README.md 3. Create Amazon Document de Cluster 4. Create RedHat Linux Machine on Amazon EC2 and configure Linux packages 5. Configure and connect to MongoDB CUI 6. Build a cluster with MongoDB 7. Connect your appication on the cluster 8. Connect to Spark using MongoDB cluster on AWS 2. Finally, you will be able to view the actual reports and data