DESIGN AN ER-DIAGRAM FOR THE FOLLOWING SCENARIO


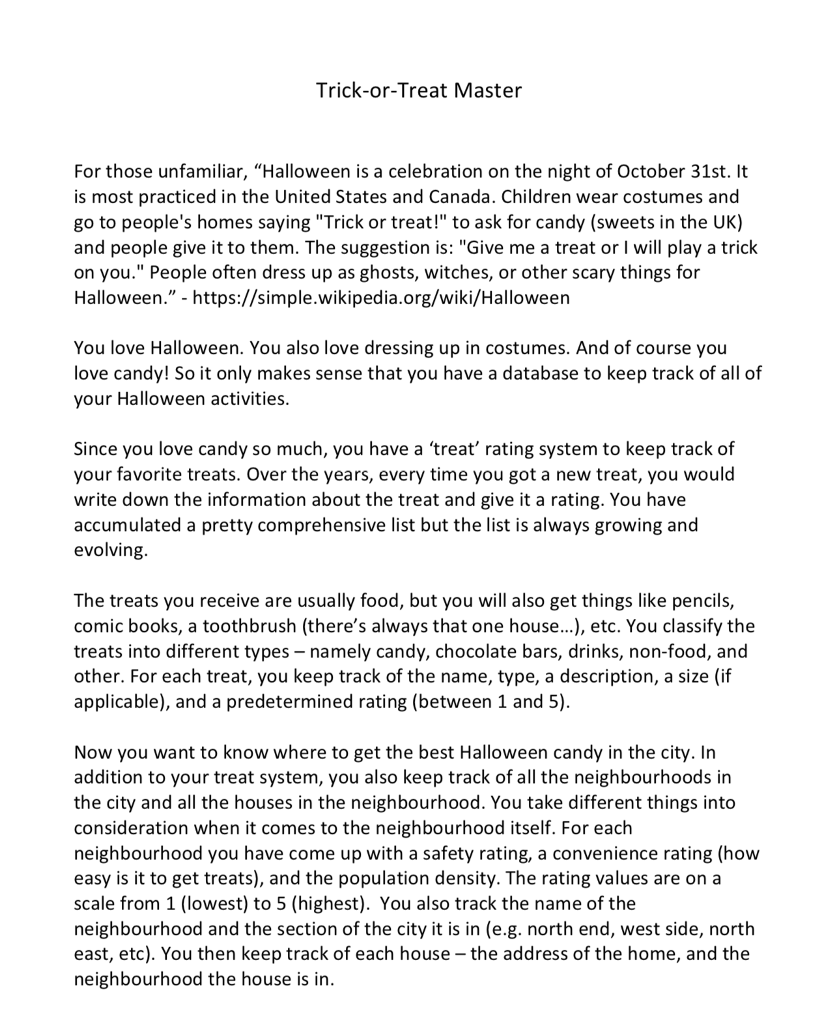
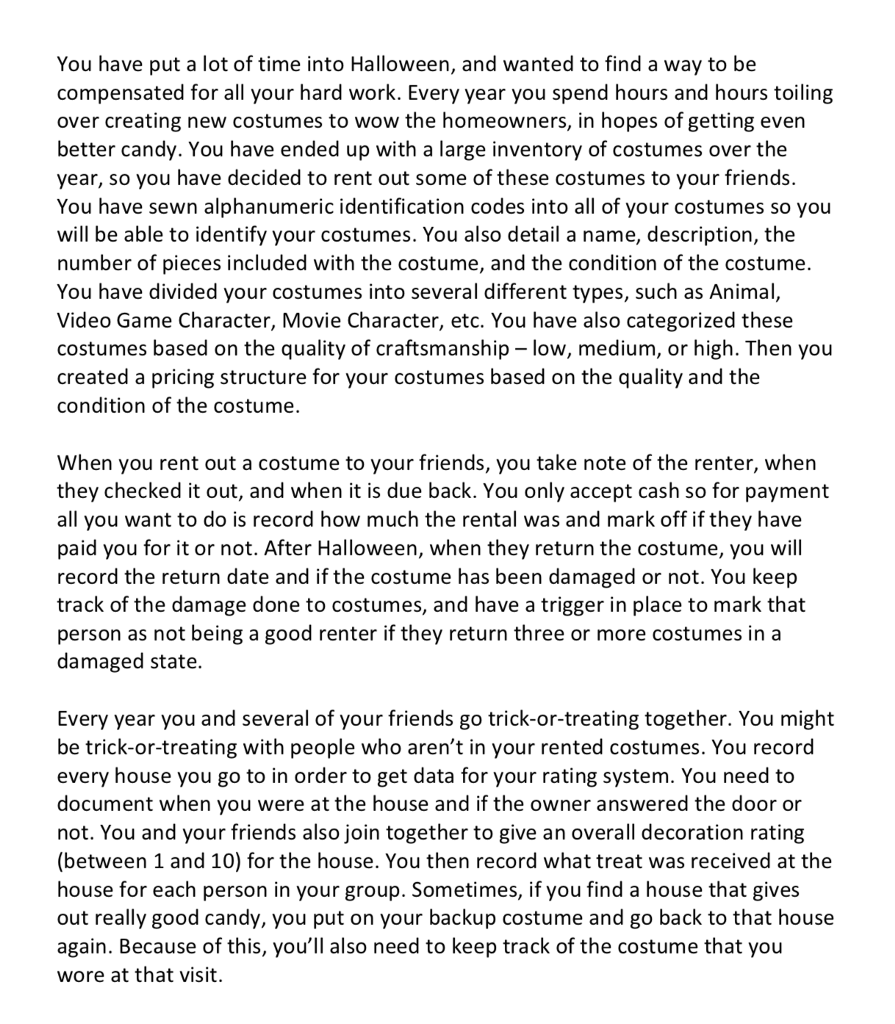
Trick-or-Treat Master For those unfamiliar, Halloween is a celebration on the night of October 31st. It is most practiced in the United States and Canada. Children wear costumes and go to people's homes saying "Trick or treat!" to ask for candy (sweets in the UK) and people give it to them. The suggestion is: "Give me a treat or I will play a trick on you." People often dress up as ghosts, witches, or other scary things for Halloween." - https://simple.wikipedia.org/wiki/Halloweern You love Halloween. You also love dressing up in costumes. And of course you love candy! So it only makes sense that you have a database to keep track of all of your Halloween activities Since you love candy so much, you have a 'treat' rating system to keep track of your favorite treats. Over the years, every time you got a new treat, you would write down the information about the treat and give it a rating. You have accumulated a pretty comprehensive list but the list is always growing and evolving The treats you receive are usually food, but you will also get things like pencils, comic books, a toothbrush (there's always that one house...), etc. You classify the treats into different types namely candy, chocolate bars, drinks, non-food, and other. For each treat, you keep track of the name, type, a description, a size (if applicable), and a predetermined rating (between 1 and 5) Now you want to know where to get the best Halloween candy in the city. In addition to your treat system, you also keep track of all the neighbourhoods in the city and all the houses in the neighbourhood. You take different things into consideration when it comes to the neighbourhood itself. For each neighbourhood you have come up with a safety rating, a convenience rating (how easy is it to get treats), and the population density. The rating values are on a scale from 1 (lowest) to 5 (highest). You also track the name of the neighbourhood and the section of the city it is in (e.g. north end, west side, north east, etc). You then keep track of each house the address of the home, and the neighbourhood the house is in Trick-or-Treat Master For those unfamiliar, Halloween is a celebration on the night of October 31st. It is most practiced in the United States and Canada. Children wear costumes and go to people's homes saying "Trick or treat!" to ask for candy (sweets in the UK) and people give it to them. The suggestion is: "Give me a treat or I will play a trick on you." People often dress up as ghosts, witches, or other scary things for Halloween." - https://simple.wikipedia.org/wiki/Halloweern You love Halloween. You also love dressing up in costumes. And of course you love candy! So it only makes sense that you have a database to keep track of all of your Halloween activities Since you love candy so much, you have a 'treat' rating system to keep track of your favorite treats. Over the years, every time you got a new treat, you would write down the information about the treat and give it a rating. You have accumulated a pretty comprehensive list but the list is always growing and evolving The treats you receive are usually food, but you will also get things like pencils, comic books, a toothbrush (there's always that one house...), etc. You classify the treats into different types namely candy, chocolate bars, drinks, non-food, and other. For each treat, you keep track of the name, type, a description, a size (if applicable), and a predetermined rating (between 1 and 5) Now you want to know where to get the best Halloween candy in the city. In addition to your treat system, you also keep track of all the neighbourhoods in the city and all the houses in the neighbourhood. You take different things into consideration when it comes to the neighbourhood itself. For each neighbourhood you have come up with a safety rating, a convenience rating (how easy is it to get treats), and the population density. The rating values are on a scale from 1 (lowest) to 5 (highest). You also track the name of the neighbourhood and the section of the city it is in (e.g. north end, west side, north east, etc). You then keep track of each house the address of the home, and the neighbourhood the house is in


