Answered step by step
Verified Expert Solution
Question
1 Approved Answer
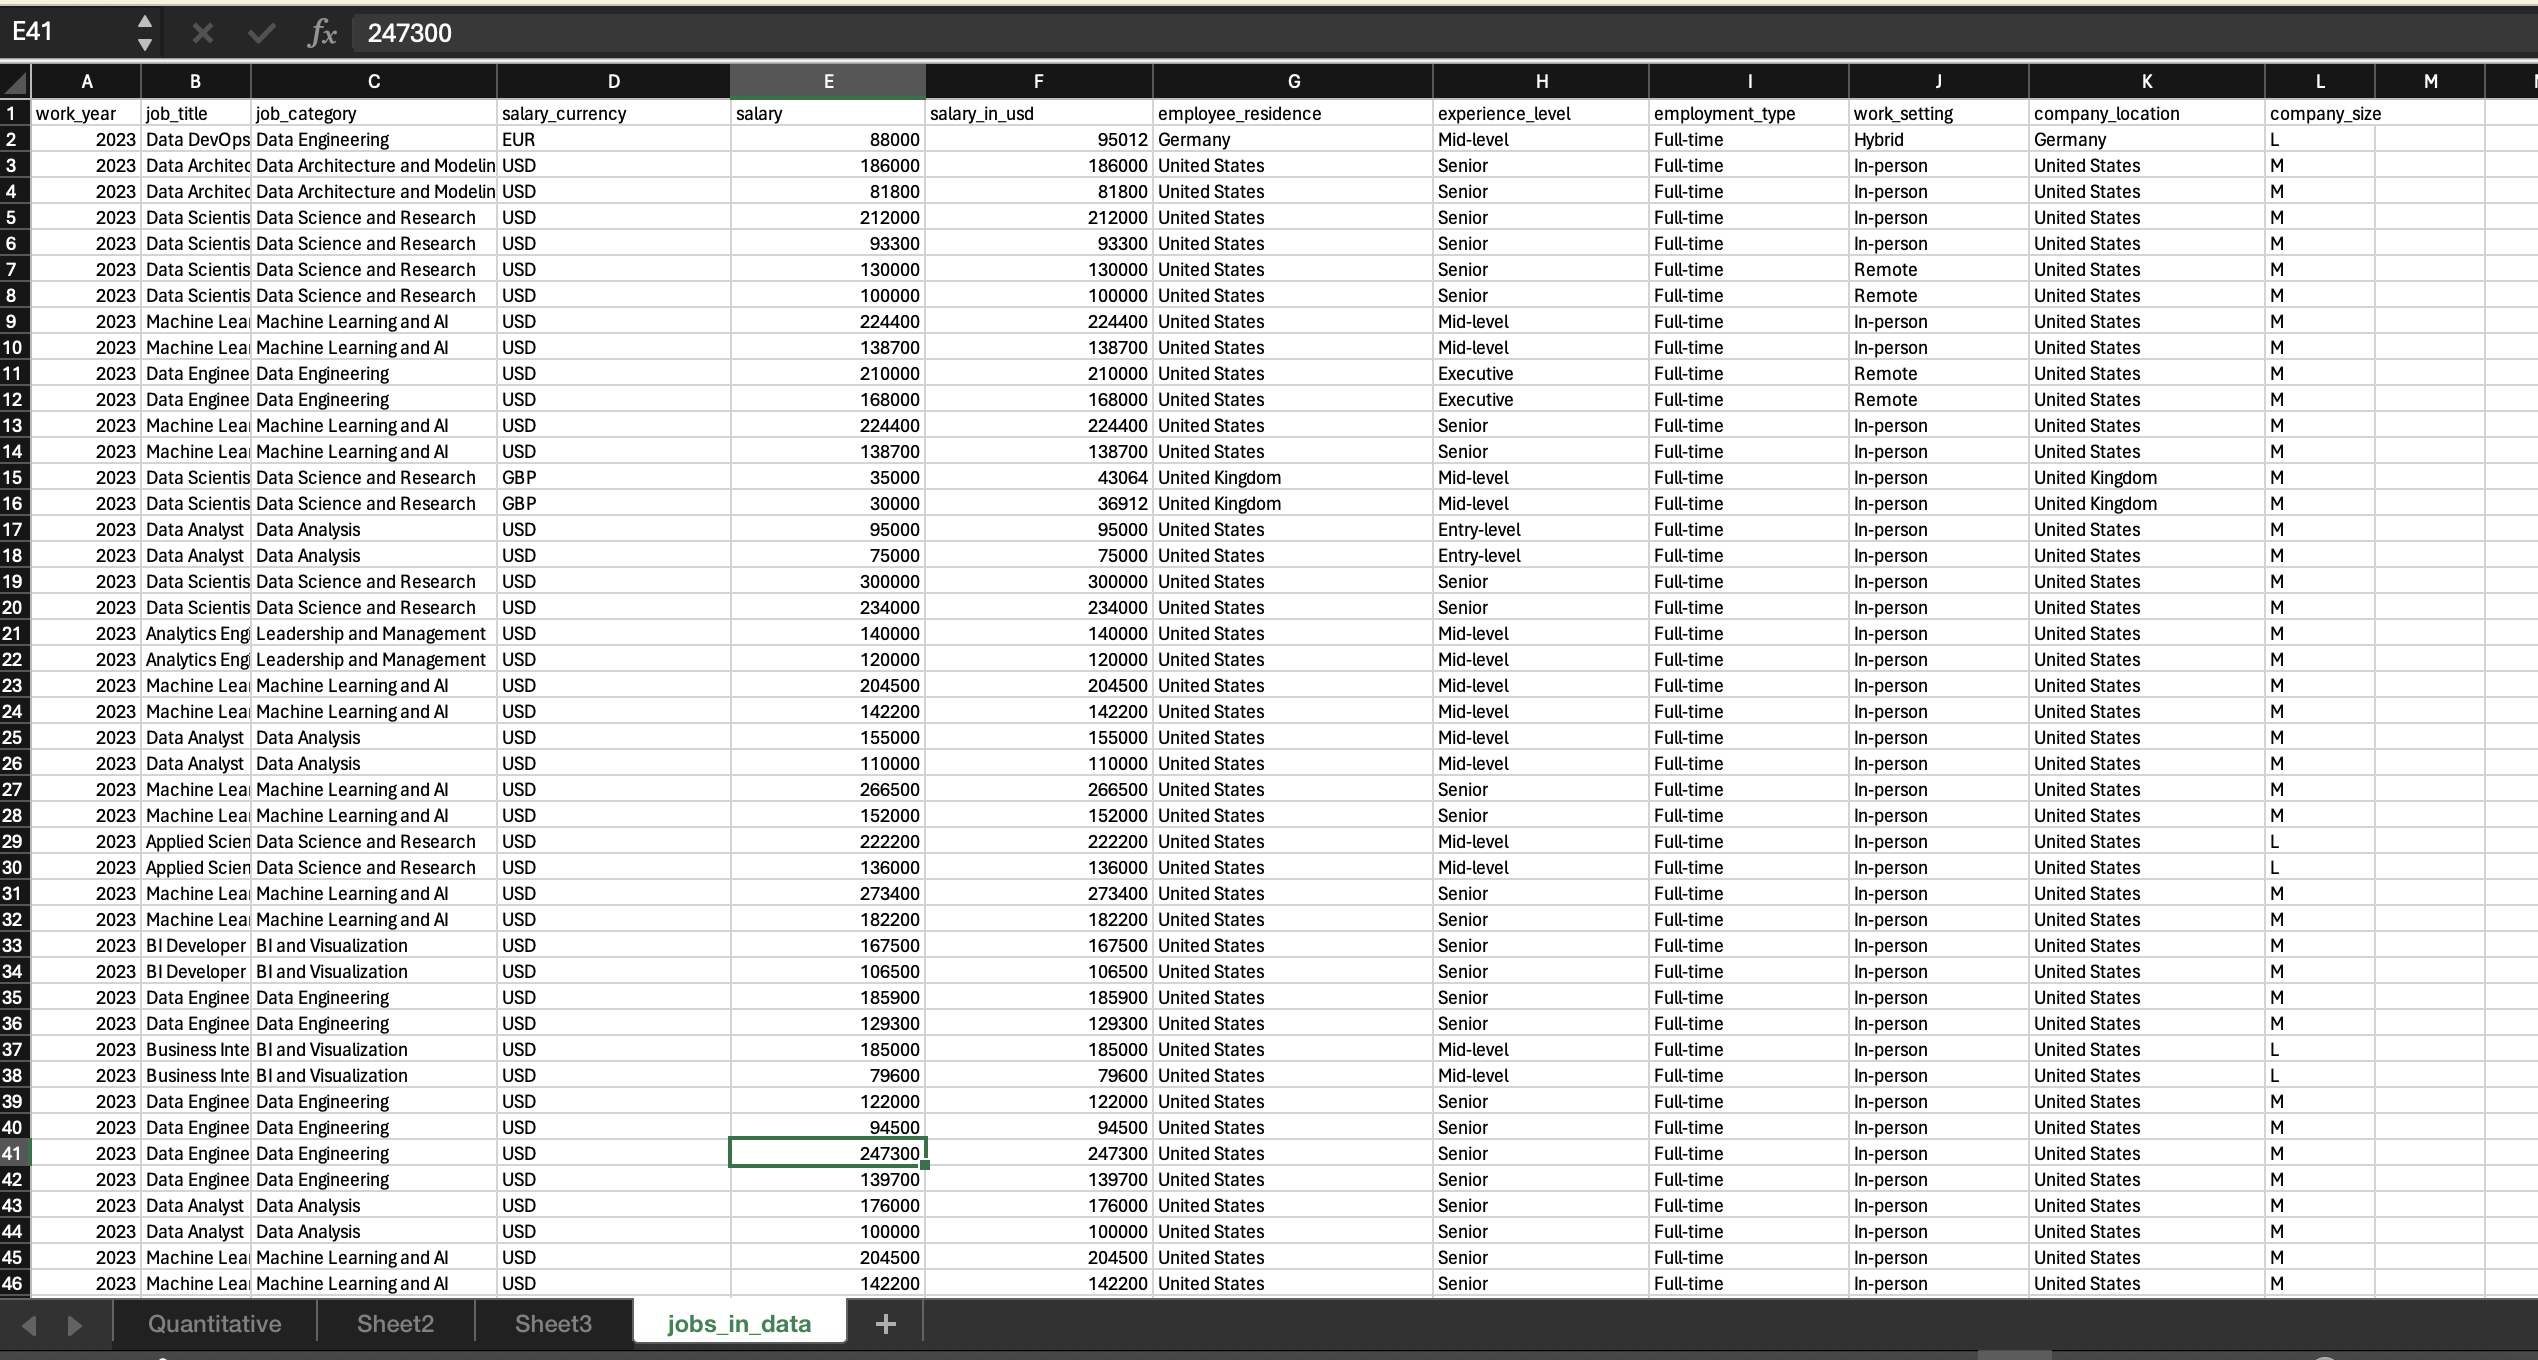
Design three charts in excel with the different columns: Quantitative, Nominal, Ordinal. Also provide a brief description for them. E41 A 1 work_year 2 3
Design three charts in excel with the different columns: Quantitative, Nominal, Ordinal. Also provide a brief description for them.

E41 A 1 work_year 2 3 4 5 6 7 8 9 10 11 12 13 14 15 16 17 18 19 20 21 22 23 24 25 26 27 28 29 30 31 32 33 34 35 36 37 38 39 40 41 42 43 44 45 46 fx 247300 B job_title job_category 2023 Data DevOps Data Engineering EUR 2023 Data Architec Data Architecture and Modelin USD 2023 Data Architec Data Architecture and Modelin USD 2023 Data Scientis Data Science and Research USD 2023 Data Scientis Data Science and Research USD 2023 Data Scientis Data Science and Research USD 2023 Data Scientis Data Science and Research USD 2023 Machine Leal Machine Learning and Al USD 2023 Machine Lea Machine Learning and Al USD 2023 Data Enginee Data Engineering USD USD USD USD 2023 Machine Leal Machine Learning and Al 2023 Data Scientis Data Science and Research GBP 2023 Data Scientis Data Science and Research GBP 2023 Data Analyst Data Analysis USD 2023 Data Analyst Data Analysis USD USD 2023 Data Scientis Data Science and Research 2023 Data Scientis Data Science and Research USD 2023 Analytics Eng Leadership and Management USD 2023 Analytics Eng Leadership and Management USD 2023 Machine Lea Machine Learning and Al USD 2023 Machine Leal Machine Learning and Al USD 2023 Data Analyst Data Analysis USD 2023 Data Analyst Data Analysis USD 2023 Machine Lea Machine Learning and Al USD USD USD USD USD USD USD USD USD USD USD USD USD USD C 2023 Data Enginee Data Engineering 2023 Machine Lea Machine Learning and Al 2023 Machine Leal Machine Learning and Al 2023 Applied Scien Data Science and Research 2023 Applied Scien Data Science and Research 2023 Machine Leal Machine Learning and Al 2023 Machine Leal Machine Learning and Al 2023 BI Developer BI and Visualization 2023 BI Developer BI and Visualization 2023 Data Enginee Data Engineering 2023 Data Enginee Data Engineering 2023 Business Inte BI and Visualization 2023 Business Inte BI and Visualization 2023 Data Enginee Data Engineering 2023 Data Enginee Data Engineering 2023 Data Enginee Data Engineering 2023 Data Enginee Data Engineering 2023 Data Analyst Data Analysis 2023 Data Analyst Data Analysis 2023 Machine Leal Machine Learning and Al 2023 Machine Leal Machine Learning and Al Quantitative Sheet2 salary_currency USD USD USD USD USD USD D Sheet3 salary jobs_in_data E 88000 186000 81800 212000 93300 130000 100000 224400 138700 210000 168000 224400 138700 35000 30000 95000 75000 300000 234000 140000 120000 204500 142200 155000 110000 266500 152000 222200 136000 273400 182200 167500 106500 185900 129300 185000 79600 122000 94500 247300 139700 176000 100000 204500 142200 F salary_in_usd G employee_residence 95012 Germany 186000 United States 81800 United States 212000 United States 93300 United States 130000 United States 100000 United States 224400 United States 138700 United States 210000 United States 168000 United States 224400 United States 138700 United States 43064 United Kingdom 36912 United Kingdom 95000 United States 75000 United States 300000 United States 234000 United States 140000 United States 120000 United States 204500 United States 142200 United States 155000 United States 110000 United States 266500 United States 152000 United States 222200 United States 136000 United States 273400 United States 182200 United States 167500 United States 106500 United States 185900 United States 129300 United States 185000 United States 79600 United States 122000 United States 94500 United States 247300 United States 139700 United States 176000 United States 100000 United States 204500 United States 142200 United States experience_level Mid-level Senior Senior Senior Senior Senior Senior Mid-level Mid-level Executive Executive Senior Senior Mid-level Mid-level Entry-level Entry-level Senior Senior Mid-level Mid-level Mid-level Mid-level Mid-level Mid-level Senior Senior Mid-level Mid-level Senior Senior Senior Senior Senior Senior Mid-level Mid-level H Senior Senior Senior Senior Senior Senior Senior Senior employment_type Full-time Full-time Full-time Full-time Full-time Full-time Full-time Full-time Full-time Full-time Full-time Full-time Full-time Full-time Full-time Full-time Full-time Full-time Full-time Full-time Full-time Full-time Full-time Full-time Full-time Full-time Full-time Full-time Full-time Full-time Full-time Full-time Full-time Full-time Full-time Full-time Full-time Full-time Full-time Full-time Full-time Full-time Full-time Full-time Full-time J work_setting Hybrid In-person In-person In-person In-person Remote Remote In-person In-person Remote Remote In-person In-person In-person In-person In-person In-person In-person In-person In-person In-person In-person In-person In-person In-person In-person In-person In-person In-person In-person In-person In-person In-person In-person In-person In-person In-person In-person In-person In-person In-person In-person In-person In-person In-person K company_location Germany United States United States United States United States United States United States United States United States United States United States United States United States United Kingdom United Kingdom United States United States United States United States United States United States United States United States United States United States United States United States United States United States United States United States United States United States United States United States United States United States United States United States United States United States United States United States United States United States L company_size L M M M M M M M M M M M M M M M M M M M M M M M M M M L L M M M M M M L L M M M M M M M M M |
Step by Step Solution
There are 3 Steps involved in it
Step: 1

Get Instant Access to Expert-Tailored Solutions
See step-by-step solutions with expert insights and AI powered tools for academic success
Step: 2

Step: 3

Ace Your Homework with AI
Get the answers you need in no time with our AI-driven, step-by-step assistance
Get Started


