Question
Detailed Sales What-if Analysis. Make sure it is centered across columns A G and has a heading format. b. Enter formulas in cells B6,
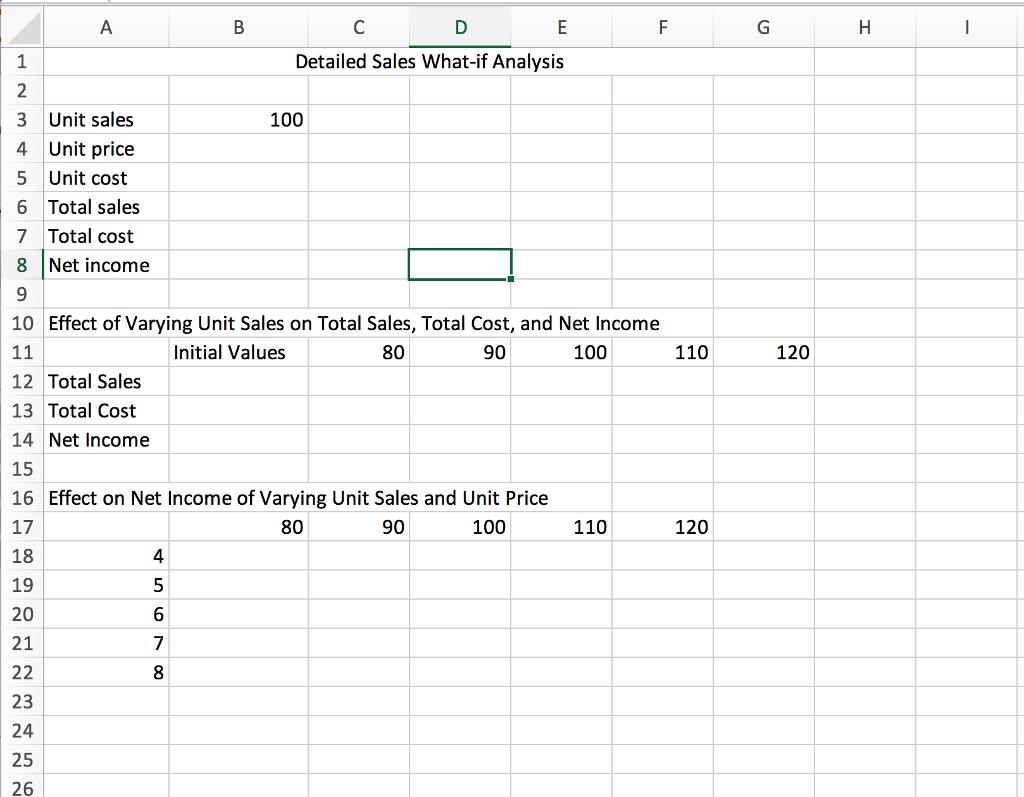
Detailed Sales What-if Analysis”. Make sure it is centered across columns A – G and has a heading format.
b. Enter formulas in cells B6, B7, and B8 to calculate the total sales, total cost, and net income for a new product line, based on the projected unit sales, unit price and unit cost provided.
c. Adjust column widths as needed and format all values except unit sales as currency with no decimal places.
d. Complete the one-variable data table under the heading “Effect of Varying Unit Sales on Total Sales, Total Cost, and Net Income” to calculate the total sales, total cost and net income for projected sales of 80, 90, 100, 110, and 120 units.
e. Complete the two-variable data table under the heading “Effect on Net Income of Varying Unit Sales and Unit Price” to calculate the net income for projected sales of 80, 90, 100, 110, and 120 units at unit prices of $4, $5, $6, $7, and $8.
f. Format cells A3 – B8 with a thick box border.
g. Format the one-variable data table with themed cell style. Make sure the Initial values, Total Sales, Total Cost and Net Income have an accent color.
h. Format the two-variable data table with a themed cell style. Make sure the initial values for the horizontal and vertical have an accent color.
i. Add conditional formatting to the one-variable data table. Format the top 10% with green fill. Format the bottom 10% with red fill. j. Save your work (CTRL+s) and close.

A 25 26 4 567 0 B 1 2 3 Unit sales 4 Unit price 5 Unit cost 6 Total sales 7 Total cost 8 Net income 9 10 Effect of Varying Unit Sales on Total Sales, Total Cost, and Net Income 11 Initial Values 80 90 100 12 Total Sales 13 Total Cost 14 Net Income 15 16 Effect on Net Income of Varying Unit Sales and Unit Price 17 80 90 100 18 19 20 21 22 23 24 8 C D Detailed Sales What-if Analysis E 100 F 110 110 120 G 120 H |
Step by Step Solution
3.33 Rating (150 Votes )
There are 3 Steps involved in it
Step: 1
Detailed Sales Whatif Analysis spreadsheet a Centered Heading Select cells A1G1 Merge the selected cells usually CtrlM or under Format Merge Center Ty...
Get Instant Access to Expert-Tailored Solutions
See step-by-step solutions with expert insights and AI powered tools for academic success
Step: 2

Step: 3

Ace Your Homework with AI
Get the answers you need in no time with our AI-driven, step-by-step assistance
Get Started


