

Question
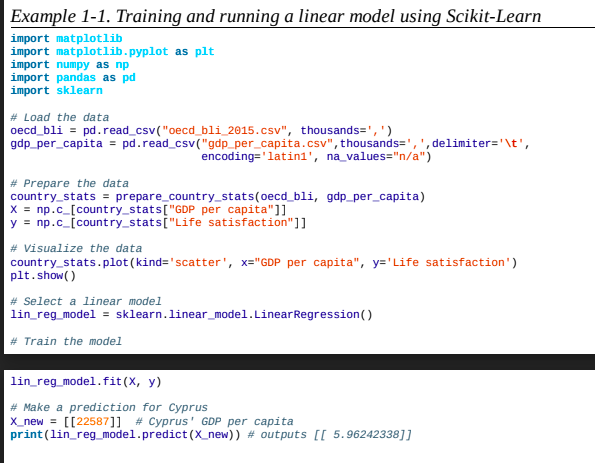
Details: Dataset founds: https://github.com/ageron/handson-ml a. Start with Example 1-1: Training and running a linear model using Scikit-Learn from Aurlien Gron textbook. b. Show the code
Details:
Dataset founds: https://github.com/ageron/handson-ml
a. Start with Example 1-1: Training and running a linear model using Scikit-Learn from Aurlien Gron textbook.
b. Show the code running under Python 3 along with correct output.
c. Modify the code have a second model using k neighbors regression with n neighbors value of 3.
d. Compare the results between the linear regression and k neighbors regression. Explain why they are different.
e. Measure the time used in the following stages: 1. Loading the data, 2. Training the model, and 3. Making the prediction. How does these measurements differ for the linear regression vs. k neighbors regression?
Please provide all source code, test cases, data files used, screen snapshots of your code being compiled, running and provide a report with your analysis and explanation of your results. You may combine all files into a single PDF file Word document file or place all files into a single ZIP archive.
Step by Step Solution
There are 3 Steps involved in it
Step: 1

Get Instant Access to Expert-Tailored Solutions
See step-by-step solutions with expert insights and AI powered tools for academic success
Step: 2

Step: 3
Ace Your Homework with AI
Get the answers you need in no time with our AI-driven, step-by-step assistance
Get Started
Logic In Databases International Workshop Lid 96 San Miniato Italy July 1 2 1996 Proceedings Lncs 1154
Authors: Dino Pedreschi ,Carlo Zaniolo
1st Edition
3540618147, 978-3540618140