Question
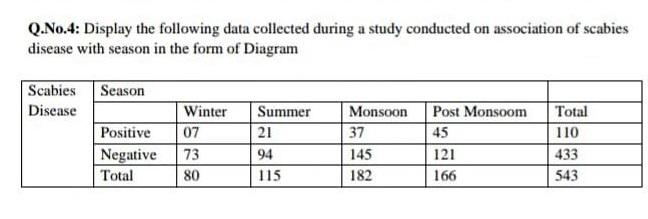
Q.No.4: Display the following data collected during a study conducted on association of scabies disease with season in the form of Diagram Scabies Season

Q.No.4: Display the following data collected during a study conducted on association of scabies disease with season in the form of Diagram Scabies Season Disease Winter Positive 07 Negative 73 Total 80 Summer 21 94 115 Monsoon Post Monsoom Total 45 110 121 166 37 145 182 433 543
Step by Step Solution
3.44 Rating (160 Votes )
There are 3 Steps involved in it
Step: 1
Post Monsoon Total Monsoon SCABIES DISEASE Sommer Winter SCABIES DI...
Get Instant Access to Expert-Tailored Solutions
See step-by-step solutions with expert insights and AI powered tools for academic success
Step: 2

Step: 3

Ace Your Homework with AI
Get the answers you need in no time with our AI-driven, step-by-step assistance
Get StartedRecommended Textbook for
Elementary Statistics
Authors: Neil A. Weiss
8th Edition
321691237, 978-0321691231
Students also viewed these Mathematics questions
Question
Answered: 1 week ago
Question
Answered: 1 week ago
Question
Answered: 1 week ago
Question
Answered: 1 week ago
Question
Answered: 1 week ago
Question
Answered: 1 week ago
Question
Answered: 1 week ago
Question
Answered: 1 week ago
Question
Answered: 1 week ago
Question
Answered: 1 week ago
Question
Answered: 1 week ago
Question
Answered: 1 week ago
Question
Answered: 1 week ago
Question
Answered: 1 week ago
Question
Answered: 1 week ago
Question
Answered: 1 week ago
Question
Answered: 1 week ago
Question
Answered: 1 week ago
Question
Answered: 1 week ago
Question
Answered: 1 week ago
Question
Answered: 1 week ago
Question
Answered: 1 week ago
View Answer in SolutionInn App


