

Answered step by step
Verified Expert Solution
Question
1 Approved Answer
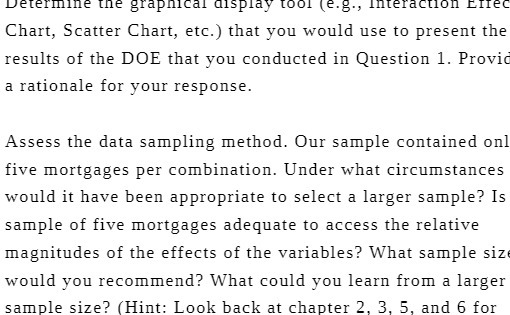
Determine the graphical display tool (e.g., Interaction LifeC Chart, Scatter Chart, etc. ) that you would use to present the results of the DOE that
Step by Step Solution
There are 3 Steps involved in it
Step: 1

Get Instant Access to Expert-Tailored Solutions
See step-by-step solutions with expert insights and AI powered tools for academic success
Step: 2

Step: 3
Ace Your Homework with AI
Get the answers you need in no time with our AI-driven, step-by-step assistance
Get Started
Elementary Linear Algebra with Applications
Authors: Howard Anton, Chris Rorres
9th edition
471669598, 978-0471669593