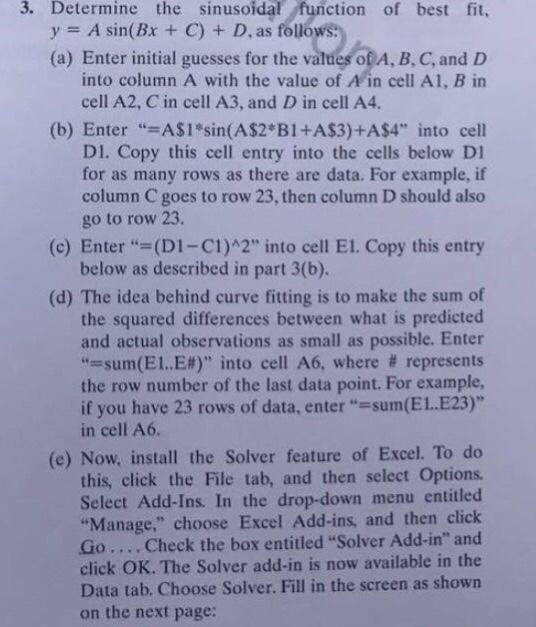
Determine the sinusoidal function of best fit, y = A sin (Bx + C) + D, as follows: (a) Enter initial guesses for the values of A, B, C, and D into column A with the value of A in cell A1, B into cell A2, C in cell A3, and D in cell A4. (b) Enter "= A$1*sin (A$2*B1 + A$3) + A$4" into cell D1. Copy this cell entry into the cells below D1 for as many rows as there are data. For example, if column C goes to row 23, then column D should also go to row 23. (c) Enter "= (D1 - C1)^2" into cell E1. Copy this entry below as described in part 3(b). (d) The idea behind curve fitting is to make the sum of the squared differences between what is predicted and actual observations as small as possible. Enter "= sum (El., E#)" into cell A6, where # represents the row number of the last data point. For example, if you have 23 rows of data, enter "= sum (EL. E23)" in cell A6. (e) Now, install the Solver feature of Excel. To do this, click the File tab, and then select options. Select Add- Ins. In the drop- down menu entitled "Manage, " choose Excel Add- ins, and then click Go Check the box entitled "Solver Add- in" and click OK. The Solver add- in is now available in the Data tab. Choose Solver. Fill in the screen as on the next page: Determine the sinusoidal function of best fit, y = A sin (Bx + C) + D, as follows: (a) Enter initial guesses for the values of A, B, C, and D into column A with the value of A in cell A1, B into cell A2, C in cell A3, and D in cell A4. (b) Enter "= A$1*sin (A$2*B1 + A$3) + A$4" into cell D1. Copy this cell entry into the cells below D1 for as many rows as there are data. For example, if column C goes to row 23, then column D should also go to row 23. (c) Enter "= (D1 - C1)^2" into cell E1. Copy this entry below as described in part 3(b). (d) The idea behind curve fitting is to make the sum of the squared differences between what is predicted and actual observations as small as possible. Enter "= sum (El., E#)" into cell A6, where # represents the row number of the last data point. For example, if you have 23 rows of data, enter "= sum (EL. E23)" in cell A6. (e) Now, install the Solver feature of Excel. To do this, click the File tab, and then select options. Select Add- Ins. In the drop- down menu entitled "Manage, " choose Excel Add- ins, and then click Go Check the box entitled "Solver Add- in" and click OK. The Solver add- in is now available in the Data tab. Choose Solver. Fill in the screen as on the next page


