Answered step by step
Verified Expert Solution
Link Copied!

Question

1 Approved Answer

Develop a 3 standard deviaton (99 73% confidence) p-chart and graph the samples. Upeer Control Limit (UCLp)= (round your response to four decimal places). Lower
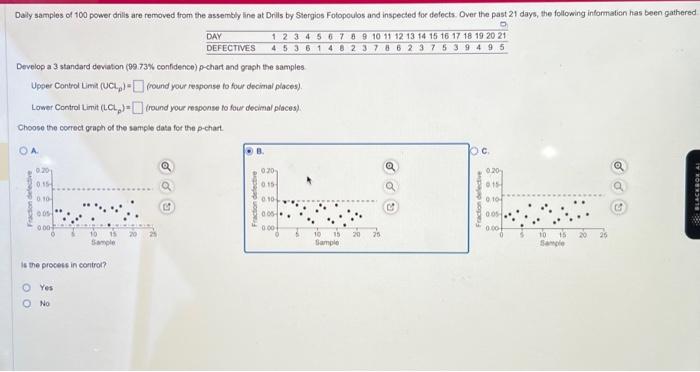
image text in transcribed
Develop a 3 standard deviaton (99 73% confidence) p-chart and graph the samples. Upeer Control Limit (UCLp)= (round your response to four decimal places). Lower Control Limit (LCLp)= (round your response fo four decimal places). Choose the cerrect graph of the sample data for the p-chart. Is the process in contron? Yes No

Step by Step Solution

There are 3 Steps involved in it

Step: 1

blur-text-image

Get Instant Access to Expert-Tailored Solutions

See step-by-step solutions with expert insights and AI powered tools for academic success

Step: 2

blur-text-image

Step: 3

blur-text-image

Ace Your Homework with AI

Get the answers you need in no time with our AI-driven, step-by-step assistance

Get Started

Recommended Textbook for

Supervision Today

Authors: Stephen P. Robbins, David A. DeCenzo, Robert M. Wolter

8th edition

133884869, 133884864, 978-0133884869

More Books

Students also viewed these General Management questions