

Answered step by step
Verified Expert Solution
Question
1 Approved Answer
Develop a healthcare business plan for Coastal Medical Centers possible new physical therapy clinic. (Exhibits 7.3, 7.4, and 7.5 may be used as Coastal Medical
Develop a healthcare business plan for Coastal Medical Centers possible new physical therapy clinic.
(Exhibits 7.3, 7.4, and 7.5 may be used as Coastal Medical Centers data).
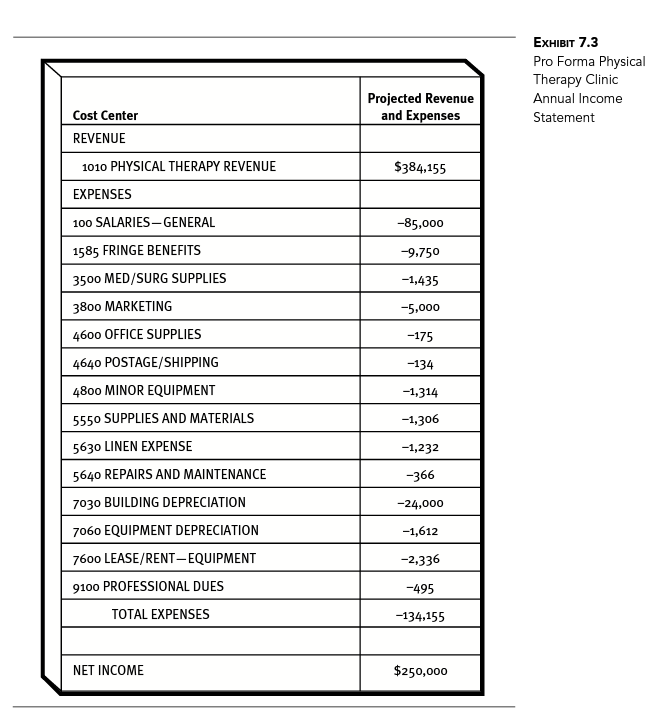
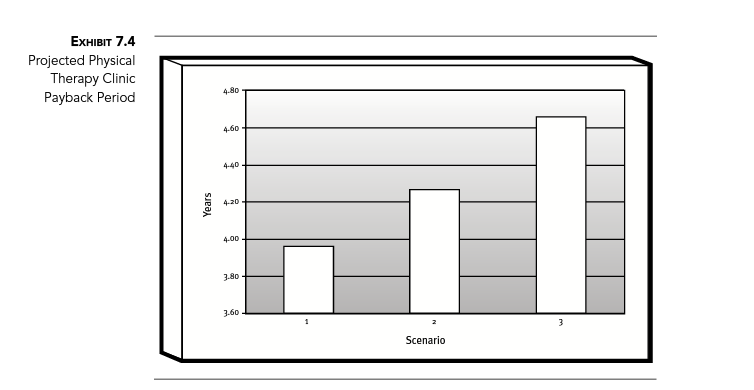
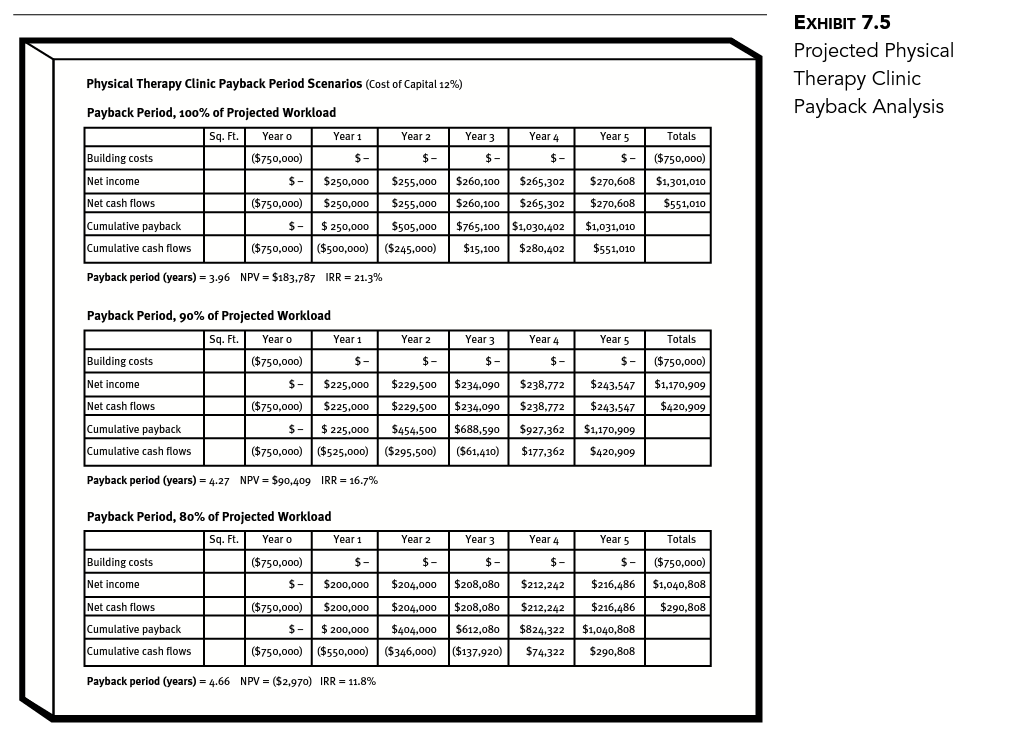
ExHIBIT 7.3 Pro Forma Physical Therapy Clinic Annual Income Statement Projected Revenue and Expenses Cost Center REVENUE S384.155 1010 PHYSICAL THERAPY REVENUE EXPENSES 100 SALARIES-GENERAL 1585 FRINGE BENEFITS 3500 MED/SURG SUPPLIES 3800 MARKETING 4600 OFFICE SUPPLIES 4640 POSTAGE/SHIPPING 4800 MINOR EQUIPMENT 5550 SUPPLIES AND MATERIALS 5630 LINEN EXPENSE 5640 REPAIRS AND MAINTENANCE 7030 BUILDING DEPRECIATION 7060 EQUIPMENT DEPRECIATION 7600 LEASE/RENT-EQUIPMENT 9100 PROFESSIONAL DUES -85,000 9.750 -1,435 -5,000 -175 -134 -1,314 -1,306 -1,232 -366 -24,000 -1,612 -2,336 -495 -134,155 TOTAL EXPENSES NET INCOME $250,000 ExHIBIT 7.4 Projected Physical Therapy Clinic Payback Period 4.80 4-60 4-40 4-20 4.00 3.80 3.60 Scenario EXHIBIT 7.5 Projected Physical Therapy Clinic Payback Analysis Physical Therapy Clinic Payback Period Scenarios (Cost of Capital 12%) Payback Period, 100% of Projected workload Sq. Ft. Year o Year 1 Year 2 Year 3 Year 4 Year 5 Totals Building costs Net income Net cash flows Cumulative payback Cumulative cash flows Payback period (years)-3.96 $-($750,000) S$250,000$255,000$260,100$265,302$270,608 $1,301,010 ($750,000) $250,ooo 255,000$260,100$265,302 $270,608$551,010 ($750,000) S-$250,000$505,000$765,100 $1,030,402 $1,031,010 ($750,000) ($500,0oo ($245,000$15,100 $280,402$551,010 NPV-$183,787 IRR-21.3% Payback Period, 90% of Projected workload Sq. Ft.Year o Year 1 Year 2 Year 3 Year 4 Year 5 Totals ($750,000) Building costs Net income Net cash flows Cumulative payback Cumulative cash flows Payback period (years)-4.27 $-($750,000) S$225,000$229,500 $234,090 $238,772$243.547$1,170,909 ($750,000) $225,000 $229,500$234,090$238,772$243.547$420,9o9 S225,000$454,500 $688,590 $927,362$1,170.909 ($750,000) |($525,000)| ($295.500) ($61.410)| $177,362 $420,909 NPV $90,409 IRR-16.7% Payback Period, 80% of Projected workload Sq. Ft.Year o Year 1 Year 2 Year 3 Year 4 Year 5 Totals ($750,o00) S-$200,000$204,000$208,08 $212,242$216,486 $1,040,808 ($750,000)$200,ooo$204,000$208,080$212,242$216,486$290,8o8 Building costs Net income Net cash flows Cumulative payback Cumulative cash flows Payback period (years)-4.66 ($750,000) S200,000$404,000 $612,080 $824,322$1,040,808 ($750,000) ($550,o ($346,000) ($137.920)$74.322$290,808 NPV-($2,970) IRR 11.8% ExHIBIT 7.3 Pro Forma Physical Therapy Clinic Annual Income Statement Projected Revenue and Expenses Cost Center REVENUE S384.155 1010 PHYSICAL THERAPY REVENUE EXPENSES 100 SALARIES-GENERAL 1585 FRINGE BENEFITS 3500 MED/SURG SUPPLIES 3800 MARKETING 4600 OFFICE SUPPLIES 4640 POSTAGE/SHIPPING 4800 MINOR EQUIPMENT 5550 SUPPLIES AND MATERIALS 5630 LINEN EXPENSE 5640 REPAIRS AND MAINTENANCE 7030 BUILDING DEPRECIATION 7060 EQUIPMENT DEPRECIATION 7600 LEASE/RENT-EQUIPMENT 9100 PROFESSIONAL DUES -85,000 9.750 -1,435 -5,000 -175 -134 -1,314 -1,306 -1,232 -366 -24,000 -1,612 -2,336 -495 -134,155 TOTAL EXPENSES NET INCOME $250,000 ExHIBIT 7.4 Projected Physical Therapy Clinic Payback Period 4.80 4-60 4-40 4-20 4.00 3.80 3.60 Scenario EXHIBIT 7.5 Projected Physical Therapy Clinic Payback Analysis Physical Therapy Clinic Payback Period Scenarios (Cost of Capital 12%) Payback Period, 100% of Projected workload Sq. Ft. Year o Year 1 Year 2 Year 3 Year 4 Year 5 Totals Building costs Net income Net cash flows Cumulative payback Cumulative cash flows Payback period (years)-3.96 $-($750,000) S$250,000$255,000$260,100$265,302$270,608 $1,301,010 ($750,000) $250,ooo 255,000$260,100$265,302 $270,608$551,010 ($750,000) S-$250,000$505,000$765,100 $1,030,402 $1,031,010 ($750,000) ($500,0oo ($245,000$15,100 $280,402$551,010 NPV-$183,787 IRR-21.3% Payback Period, 90% of Projected workload Sq. Ft.Year o Year 1 Year 2 Year 3 Year 4 Year 5 Totals ($750,000) Building costs Net income Net cash flows Cumulative payback Cumulative cash flows Payback period (years)-4.27 $-($750,000) S$225,000$229,500 $234,090 $238,772$243.547$1,170,909 ($750,000) $225,000 $229,500$234,090$238,772$243.547$420,9o9 S225,000$454,500 $688,590 $927,362$1,170.909 ($750,000) |($525,000)| ($295.500) ($61.410)| $177,362 $420,909 NPV $90,409 IRR-16.7% Payback Period, 80% of Projected workload Sq. Ft.Year o Year 1 Year 2 Year 3 Year 4 Year 5 Totals ($750,o00) S-$200,000$204,000$208,08 $212,242$216,486 $1,040,808 ($750,000)$200,ooo$204,000$208,080$212,242$216,486$290,8o8 Building costs Net income Net cash flows Cumulative payback Cumulative cash flows Payback period (years)-4.66 ($750,000) S200,000$404,000 $612,080 $824,322$1,040,808 ($750,000) ($550,o ($346,000) ($137.920)$74.322$290,808 NPV-($2,970) IRR 11.8%
Step by Step Solution
There are 3 Steps involved in it
Step: 1

Get Instant Access to Expert-Tailored Solutions
See step-by-step solutions with expert insights and AI powered tools for academic success
Step: 2

Step: 3
Ace Your Homework with AI
Get the answers you need in no time with our AI-driven, step-by-step assistance
Get Started
Financial Markets and Institutions
Authors: Jeff Madura
12th edition
9781337515535, 1337099740, 1337515531, 978-1337099745