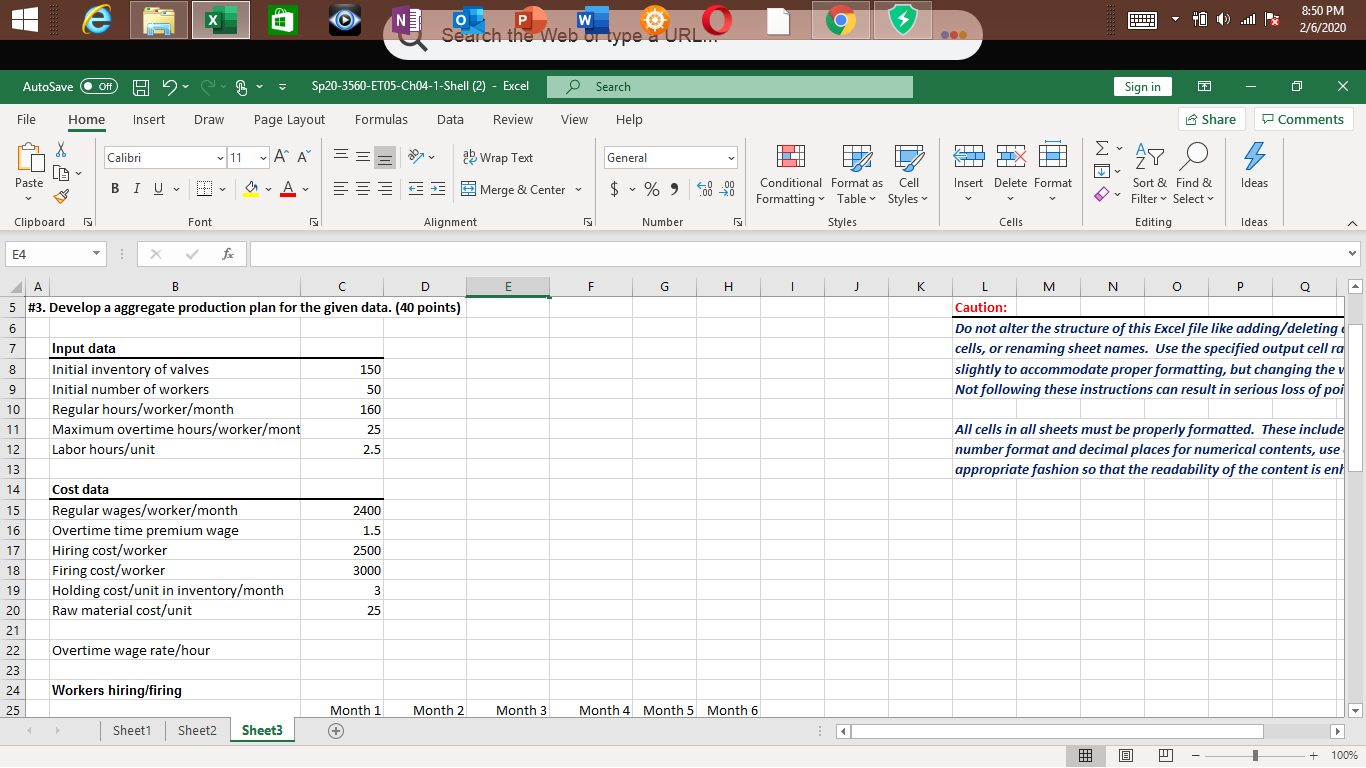
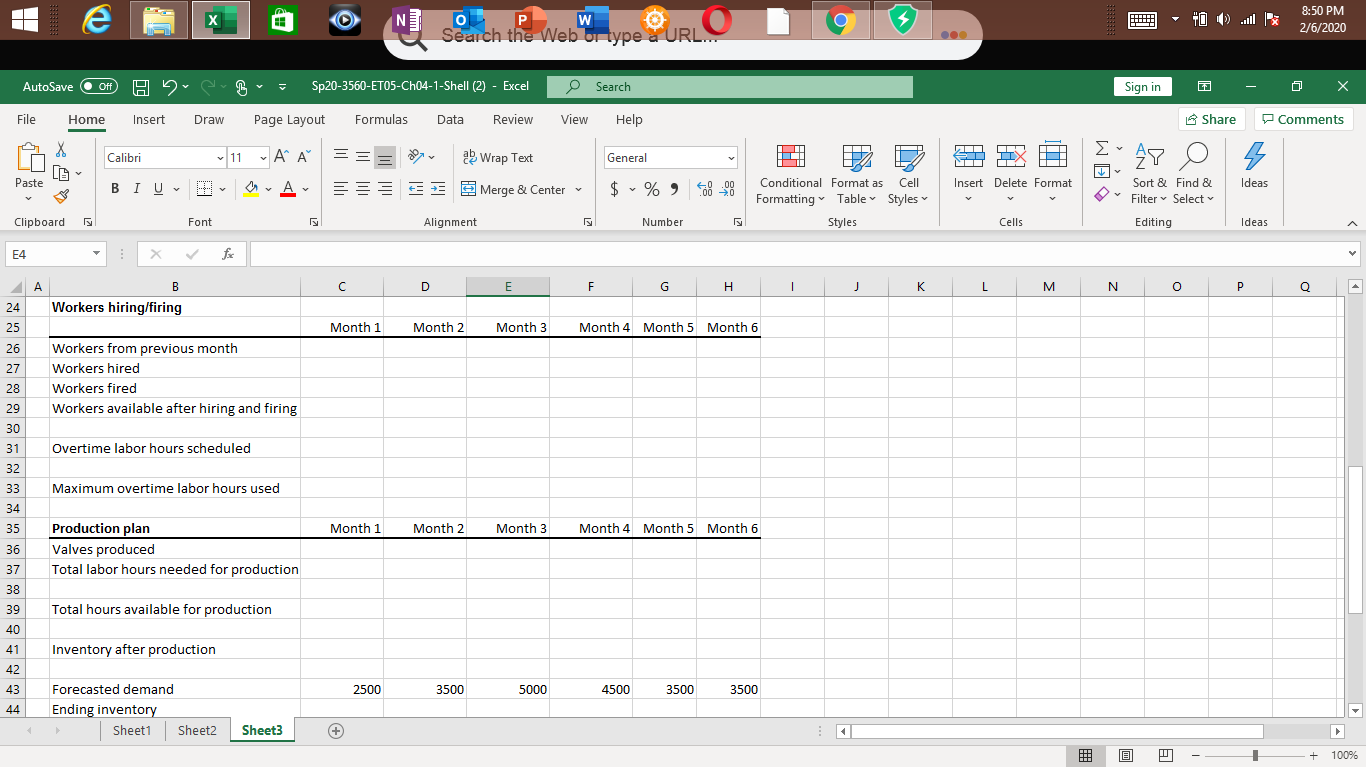
Develop an aggregate production plan for the given data.
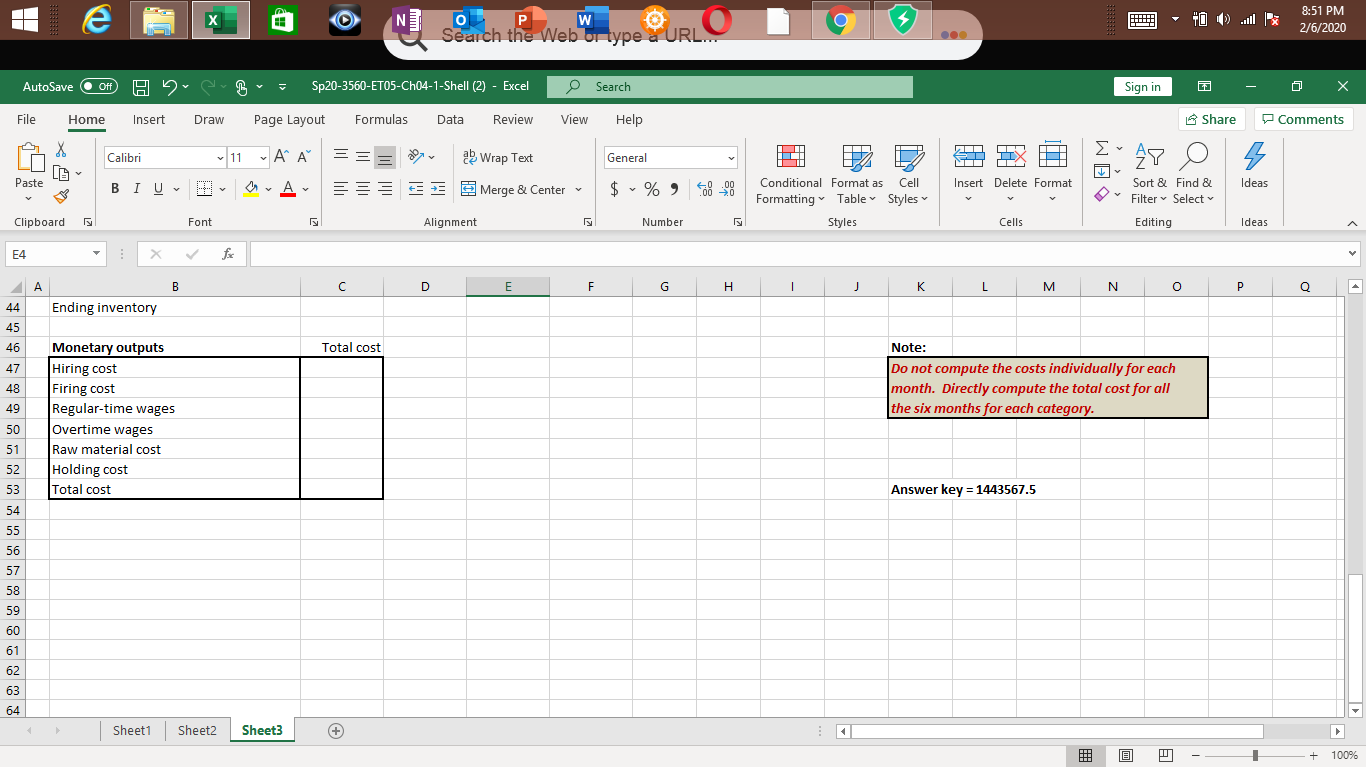
Do not compute the costs individually for each month. Directly compute the total cost for all the six months for each category.
Total cost must = 1443567.5


2 8:50 PM - 1 + 2/6/2020 Search the Web or type AutoSave ott H Sp20-3560-ETOS-Ch04-1- Shell (2) - Excel S earch 0 X Comments File Home Insert Draw Page Layout Formulas Data Review View Help Calibri A A E General 11 DA 5 === F Sign in - Share E AY O Sort & Find & Ideas Filter Select Editing Ideas Wrap Text Merge & Center - Paste BIU - $ - % -28 Insert Delete Format Conditional Format as Formatting Table Styles Cell Styles Clipboard Font a Alignment Number Cells IA E F G H I J K A D 5 #3. Develop a aggregate production plan for the given data. (40 points) L M N O P Q Caution: Do not alter the structure of this Excel file like adding/deleting cells, or renaming sheet names. Use the specified output cell ra slightly to accommodate proper formatting, but changing the v Not following these instructions can result in serious loss of poi 7 Input data Initial inventory of valves Initial number of workers Regular hours/worker/month Maximum overtime hours/worker/mont Labor hours/unit 150 50 160 All cells in all sheets must be properly formatted. These include number format and decimal places for numerical contents, use appropriate fashion so that the readability of the content is en Cost data Regular wages/worker/month Overtime time premium wage Hiring cost/worker Firing cost/worker Holding cost/unit in inventory/month Raw material cost/unit 2400 1.5 2500 3000 25 Overtime wage rate/hour Workers hiring/firing 25 Month 2 Month 3 Month 4 Month 5 Month 6 Sheet1 Sheet2 Sheet3 Month 1 + @ - - 2 8:50 PM - 1 + 2/6/2020 Search the Web or type AutoSave ott H Sp20-3560-ETOS-Ch04-1- Shell (2) - Excel S earch 0 X Comments File Home Insert Draw Page Layout Formulas Data Review View Help DIB Calibri A A General A 12 D E 11 DA === F Wrap Text Merge & Center - Sign in - Share E' 47 O 5 Sort & Find & Ideas Filter Select Editing Ideas Paste $ - % -28 Insert Delete Format Conditional Format as Formatting Table Styles Cell Styles BIU - Font | x Clipboard Alignment Number Cells fox C D E F G H I J K L M N O P Q A B Workers hiring/firing Month 1 Month 2 Month 3 Month 4 Month 5 Month 6 Workers from previous month Workers hired Workers fired Workers available after hiring and firing Overtime labor hours scheduled Maximum overtime labor hours used Month 1 Month 2 Month 3 Month 4 Month 5 Month 6 Production plan Valves produced Total labor hours needed for production Total hours available for production Inventory after production 43 2500 3500 5000 4500 3500 3500 44 Forecasted demand Ending inventory Sheet1 Sheet2 Sheet3 @ - - 2 8:51 PM - 1 + 2/6/2020 Search the Web or type AutoSave ott H Sp20-3560-ETOS-Ch04-1- Shell (2) - Excel S earch - 0 X Comments File Home Insert Draw Page Layout Formulas Data Review View Help Sign in Share E E' 47 O Insert Delete Formato sapere Fire | Calibri A A General A 5 11 DA === F Wrap Text Merge & Center - 12 D Format as societate Paste BIU - $ - % -28 Insert Delete Format Ideas Conditional Format as Formatting Table Styles Cell Styles Sort & Find & Filter Select Editing Clipboard Font Alignment Number Cells Ideas F G H I J K L M N O P Q 44 Ending inventory Total cost Note: Do not compute the costs individually for each month. Directly compute the total cost for all the six months for each category. Monetary outputs Hiring cost Firing cost Regular-time wages Overtime wages Raw material cost Holding cost Total cost Answer key = 1443567.5 Sheet1 Sheet2 Sheet3 DJ -_ 2 8:50 PM - 1 + 2/6/2020 Search the Web or type AutoSave ott H Sp20-3560-ETOS-Ch04-1- Shell (2) - Excel S earch 0 X Comments File Home Insert Draw Page Layout Formulas Data Review View Help Calibri A A E General 11 DA 5 === F Sign in - Share E AY O Sort & Find & Ideas Filter Select Editing Ideas Wrap Text Merge & Center - Paste BIU - $ - % -28 Insert Delete Format Conditional Format as Formatting Table Styles Cell Styles Clipboard Font a Alignment Number Cells IA E F G H I J K A D 5 #3. Develop a aggregate production plan for the given data. (40 points) L M N O P Q Caution: Do not alter the structure of this Excel file like adding/deleting cells, or renaming sheet names. Use the specified output cell ra slightly to accommodate proper formatting, but changing the v Not following these instructions can result in serious loss of poi 7 Input data Initial inventory of valves Initial number of workers Regular hours/worker/month Maximum overtime hours/worker/mont Labor hours/unit 150 50 160 All cells in all sheets must be properly formatted. These include number format and decimal places for numerical contents, use appropriate fashion so that the readability of the content is en Cost data Regular wages/worker/month Overtime time premium wage Hiring cost/worker Firing cost/worker Holding cost/unit in inventory/month Raw material cost/unit 2400 1.5 2500 3000 25 Overtime wage rate/hour Workers hiring/firing 25 Month 2 Month 3 Month 4 Month 5 Month 6 Sheet1 Sheet2 Sheet3 Month 1 + @ - - 2 8:50 PM - 1 + 2/6/2020 Search the Web or type AutoSave ott H Sp20-3560-ETOS-Ch04-1- Shell (2) - Excel S earch 0 X Comments File Home Insert Draw Page Layout Formulas Data Review View Help DIB Calibri A A General A 12 D E 11 DA === F Wrap Text Merge & Center - Sign in - Share E' 47 O 5 Sort & Find & Ideas Filter Select Editing Ideas Paste $ - % -28 Insert Delete Format Conditional Format as Formatting Table Styles Cell Styles BIU - Font | x Clipboard Alignment Number Cells fox C D E F G H I J K L M N O P Q A B Workers hiring/firing Month 1 Month 2 Month 3 Month 4 Month 5 Month 6 Workers from previous month Workers hired Workers fired Workers available after hiring and firing Overtime labor hours scheduled Maximum overtime labor hours used Month 1 Month 2 Month 3 Month 4 Month 5 Month 6 Production plan Valves produced Total labor hours needed for production Total hours available for production Inventory after production 43 2500 3500 5000 4500 3500 3500 44 Forecasted demand Ending inventory Sheet1 Sheet2 Sheet3 @ - - 2 8:51 PM - 1 + 2/6/2020 Search the Web or type AutoSave ott H Sp20-3560-ETOS-Ch04-1- Shell (2) - Excel S earch - 0 X Comments File Home Insert Draw Page Layout Formulas Data Review View Help Sign in Share E E' 47 O Insert Delete Formato sapere Fire | Calibri A A General A 5 11 DA === F Wrap Text Merge & Center - 12 D Format as societate Paste BIU - $ - % -28 Insert Delete Format Ideas Conditional Format as Formatting Table Styles Cell Styles Sort & Find & Filter Select Editing Clipboard Font Alignment Number Cells Ideas F G H I J K L M N O P Q 44 Ending inventory Total cost Note: Do not compute the costs individually for each month. Directly compute the total cost for all the six months for each category. Monetary outputs Hiring cost Firing cost Regular-time wages Overtime wages Raw material cost Holding cost Total cost Answer key = 1443567.5 Sheet1 Sheet2 Sheet3 DJ -_


