

Question
Dexterity, as a measure of hand function, is an important component of a thorough hand evaluation. This is especially true in children, for whom the
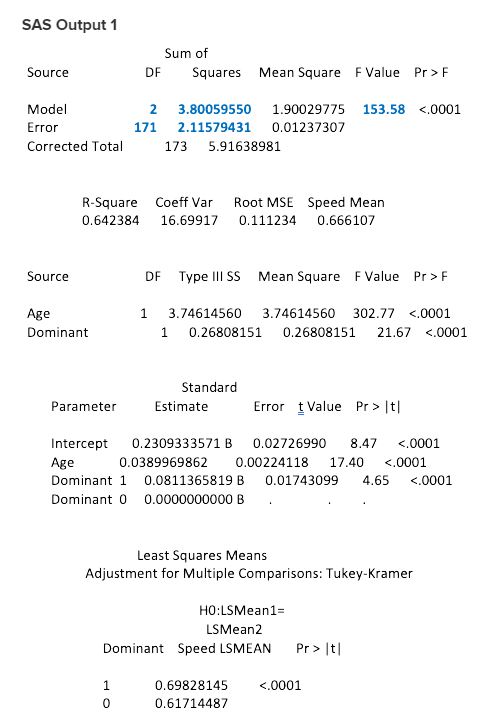
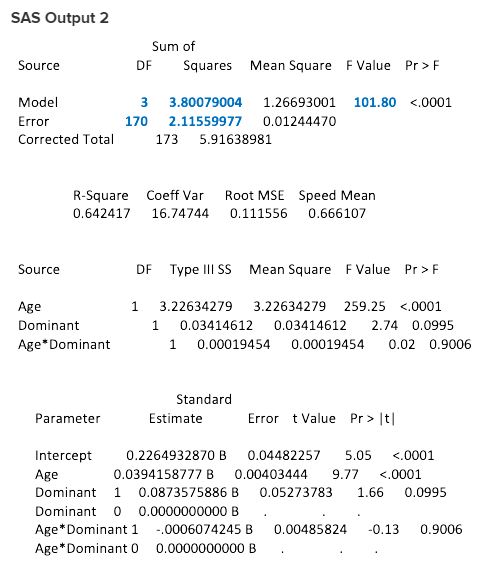
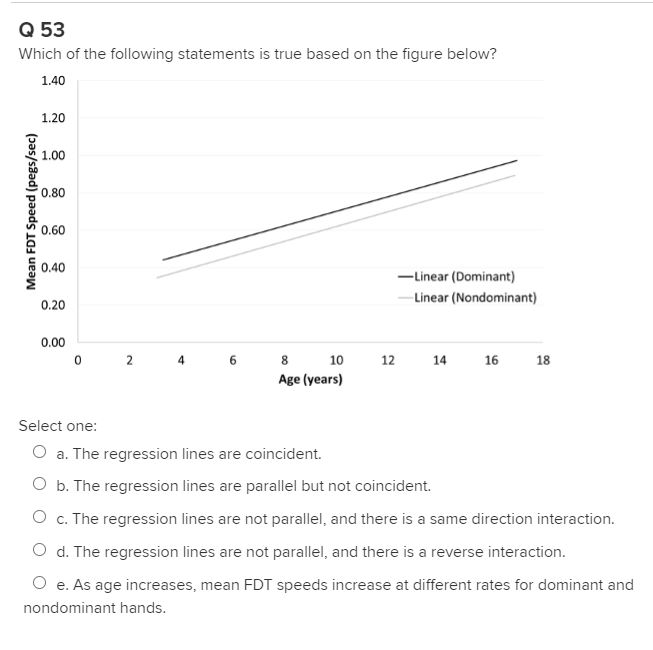
Dexterity, as a measure of hand function, is an important component of a thorough hand evaluation. This is especially true in children, for whom the relationship between the commonly measured parameters of range of motion, sensation, and strength may not reflect actual functional ability. Gogola et al. (2013) conducted a study to document normative values from the Functional Dexterity Test (FTD) for typically developing children and to optimize test administration and interpretation. The FDT is a timed pegboard test consisting of 16 thick cylindrical pegs arranged in 4 rows of 4 pegs each. Patients turn over all pegs in a specified order by manipulating each peg in their hand. A total of 174 typically developing children aged 3 to 17 years participated in the study. Children completed the 16-peg FDT with either their dominant (n=105) or nondominant (n=69) hand, and elapsed time was recorded in seconds. Data were analyzed as 16/time, interpreted as FDT speed (pegs per second). Using a 0.05 significance level and the given computer output, you need to test the claim that the mean FDT speeds for dominant (1) and nondominant (0) hands differ significantly after adjusting for age (in years) by answering the questions that follow.
These data were analyzed using two different models. Results from the analysis are provided below labeled SAS Output 1 and SAS Output 2. To answer some of the questions that follow, you need to fill in some critical pieces of information that have been deleted.
SAS Output 1
Step by Step Solution
There are 3 Steps involved in it
Step: 1

Get Instant Access to Expert-Tailored Solutions
See step-by-step solutions with expert insights and AI powered tools for academic success
Step: 2

Step: 3
Ace Your Homework with AI
Get the answers you need in no time with our AI-driven, step-by-step assistance
Get Started
Elementary Algebra
Authors: Charles P McKeague
2nd Edition
1483263819, 9781483263816