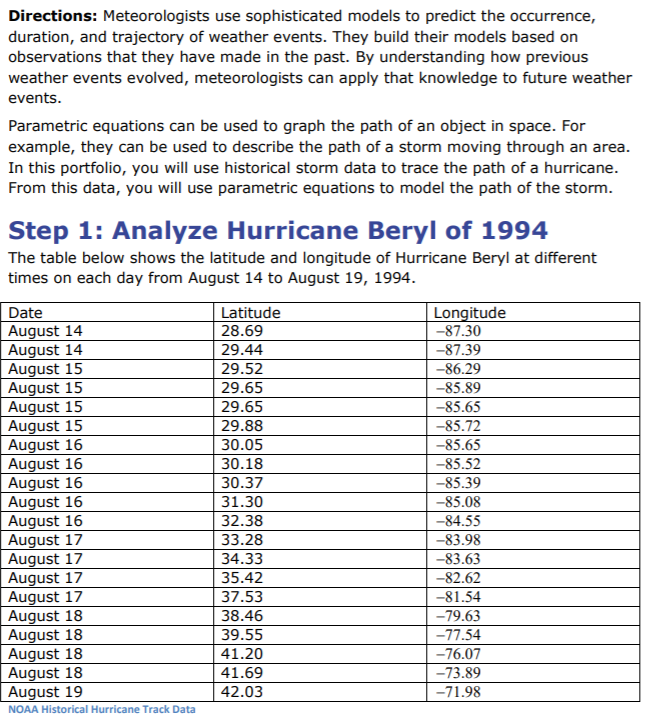
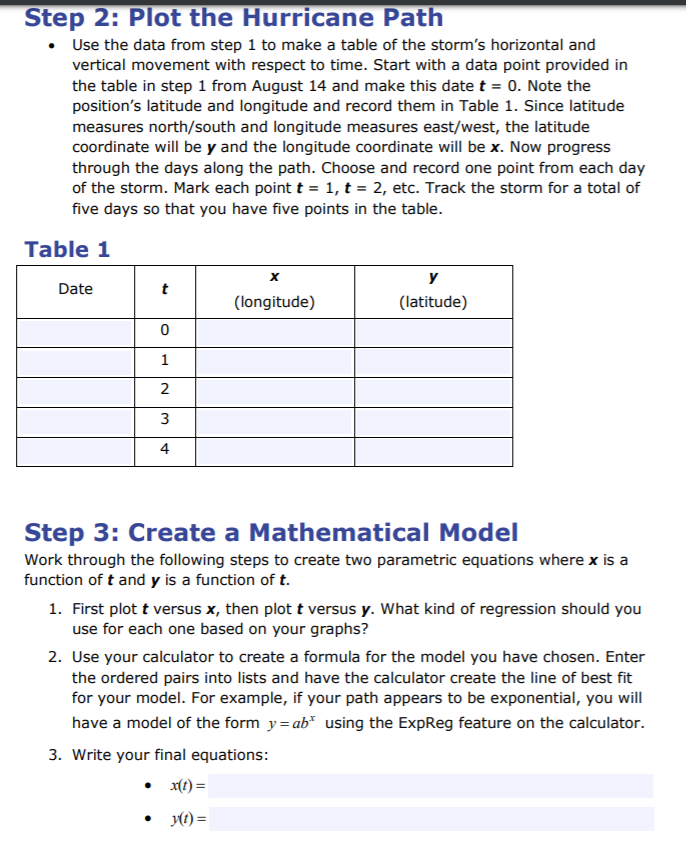

Directions: Meteorologists use sophisticated models to predict the occurrence, duration, and trajectory of weather events. They build their models based on observations that they have made in the past. By understanding how previous weather events evolved, meteorologists can apply that knowledge to future weather events Parametric equations can be used to graph the path of an object in space. For example, they can be used to describe the path of a storm moving through an area In this portfolio, you will use historical storm data to trace the path of a hurricane From this data, you will use parametric equations to model the path of the storm Step 1: Analyze Hurricane Beryl of 1994 The table below shows the latitude and longitude of Hurricane Beryl at different times on each day from August 14 to August 19, 1994 Date August 14 August 14 August 15 August 15 August 15 August 15 August 16 August 16 August 16 August 16 August 16 August 17 August 17 August 17 August 17 August 18 August 18 August 18 August 18 August 19 NOAA Historical Hurricane Track Data Latitude 28.69 29.44 29.52 29.65 29.65 29.88 30.05 30.18 30.37 31.30 32.38 33.28 34.33 35.42 37.53 38.46 39.55 41.20 41.69 42.03 Longitude -87.30 -87.39 -86.29 85.89 -85.65 -85.72 -85.65 85.52 -85.39 -85.08 -84.55 83.98 -83.63 -82.62 -81.54 -79.63 77.54 -76.07 73.89 71.98 Step 2: Plot the Hurricane Path . Use the data from step 1 to make a table of the storm's horizontal and vertical movement with respect to time. Start with a data point provided in the table in step 1 from August 14 and make this date t-0. Note thee position's latitude and longitude and record them in Table 1. Since latitude measures north/south and longitude measures east/west, the latitude coordinate will be y and the longitude coordinate will be x. Now progress through the days along the path. Choose and record one point from each day of the storm. Mark each point t1, t- 2, etc. Track the storm for a total of five days so that you have five points in the table Table 1 Date (longitude) (latitude) 0 2 4 Step 3: Create a Mathematical Model Work through the following steps to create two parametric equations where x is a function of t and y is a function oft 1. First plot t versus x, then plot t versus y. What kind of regression should you use for each one based on your graphs? 2. Use your calculator to create a formula for the model you have chosen. Enter the ordered pairs into lists and have the calculator create the line of best fit for your model. For example, if your path appears to be exponential, you will have a model of the form y ab using the ExpReg feature on the calculator. 3. Write your final equations: Plug in the values t-0, 1, 2, 3, and 4 into your parametric equations and insert your values for x and y in the table below. Table 2 (longitude) (latitude) 0 2 3 4 Now graph the x- and y-coordinates from Table 1 onto graph paper using one color, and graph the x- and y-coordinates from Table 2 onto the same graph paper using a different color. You may either copy and paste your graph here or upload it along with this worksheet. Compare the model points with the original points and answer the following questions: 1. How does your model compare to the actual path? 2. Why did you choose the graph family that you did? Did you choose well? Why or why not? 3. Is it possible to solve at) for t, substitute it into yt) to eliminate the parameter, t, and write it as a rectangular equation with x and y instead? Why or why not? Directions: Meteorologists use sophisticated models to predict the occurrence, duration, and trajectory of weather events. They build their models based on observations that they have made in the past. By understanding how previous weather events evolved, meteorologists can apply that knowledge to future weather events Parametric equations can be used to graph the path of an object in space. For example, they can be used to describe the path of a storm moving through an area In this portfolio, you will use historical storm data to trace the path of a hurricane From this data, you will use parametric equations to model the path of the storm Step 1: Analyze Hurricane Beryl of 1994 The table below shows the latitude and longitude of Hurricane Beryl at different times on each day from August 14 to August 19, 1994 Date August 14 August 14 August 15 August 15 August 15 August 15 August 16 August 16 August 16 August 16 August 16 August 17 August 17 August 17 August 17 August 18 August 18 August 18 August 18 August 19 NOAA Historical Hurricane Track Data Latitude 28.69 29.44 29.52 29.65 29.65 29.88 30.05 30.18 30.37 31.30 32.38 33.28 34.33 35.42 37.53 38.46 39.55 41.20 41.69 42.03 Longitude -87.30 -87.39 -86.29 85.89 -85.65 -85.72 -85.65 85.52 -85.39 -85.08 -84.55 83.98 -83.63 -82.62 -81.54 -79.63 77.54 -76.07 73.89 71.98 Step 2: Plot the Hurricane Path . Use the data from step 1 to make a table of the storm's horizontal and vertical movement with respect to time. Start with a data point provided in the table in step 1 from August 14 and make this date t-0. Note thee position's latitude and longitude and record them in Table 1. Since latitude measures north/south and longitude measures east/west, the latitude coordinate will be y and the longitude coordinate will be x. Now progress through the days along the path. Choose and record one point from each day of the storm. Mark each point t1, t- 2, etc. Track the storm for a total of five days so that you have five points in the table Table 1 Date (longitude) (latitude) 0 2 4 Step 3: Create a Mathematical Model Work through the following steps to create two parametric equations where x is a function of t and y is a function oft 1. First plot t versus x, then plot t versus y. What kind of regression should you use for each one based on your graphs? 2. Use your calculator to create a formula for the model you have chosen. Enter the ordered pairs into lists and have the calculator create the line of best fit for your model. For example, if your path appears to be exponential, you will have a model of the form y ab using the ExpReg feature on the calculator. 3. Write your final equations: Plug in the values t-0, 1, 2, 3, and 4 into your parametric equations and insert your values for x and y in the table below. Table 2 (longitude) (latitude) 0 2 3 4 Now graph the x- and y-coordinates from Table 1 onto graph paper using one color, and graph the x- and y-coordinates from Table 2 onto the same graph paper using a different color. You may either copy and paste your graph here or upload it along with this worksheet. Compare the model points with the original points and answer the following questions: 1. How does your model compare to the actual path? 2. Why did you choose the graph family that you did? Did you choose well? Why or why not? 3. Is it possible to solve at) for t, substitute it into yt) to eliminate the parameter, t, and write it as a rectangular equation with x and y instead? Why or why not