Discuss enviornmental industry analysis of decisions:
-
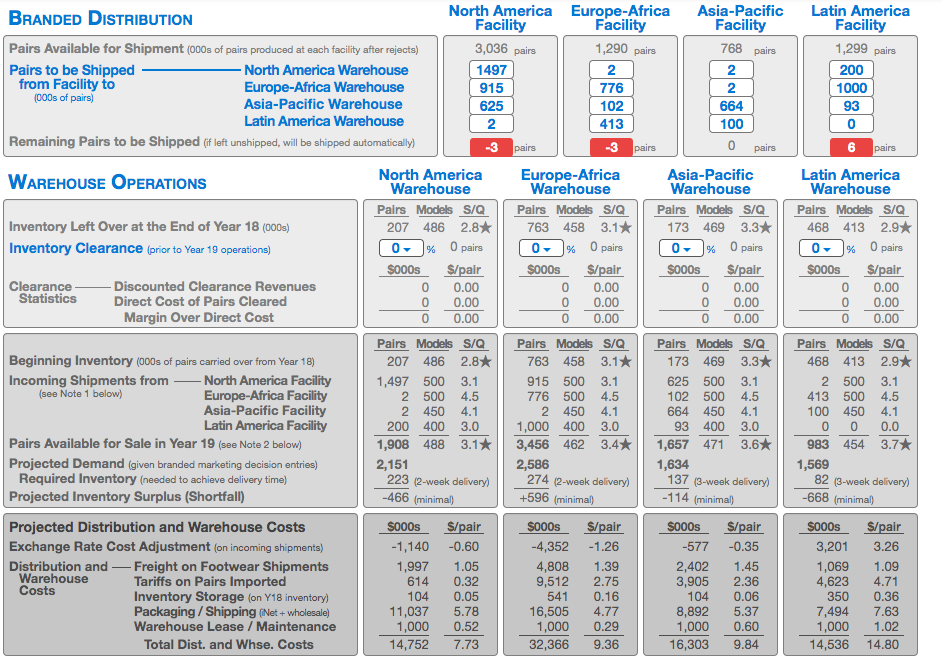
Determined which regions to ship shoes to each year based on the current economic makeup of each region and the respective exchange rates
-
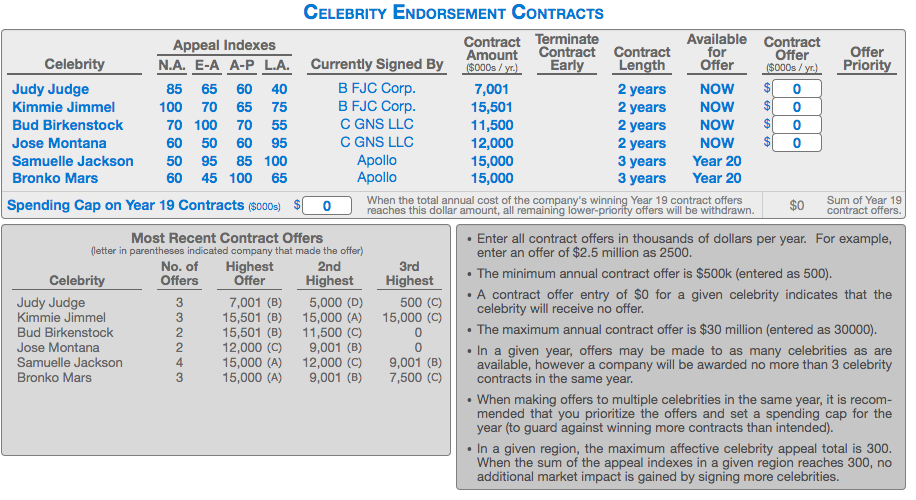
Politically/socially we did our best to partner with celebrities that would increase the appeal of the sneakers in each region
-
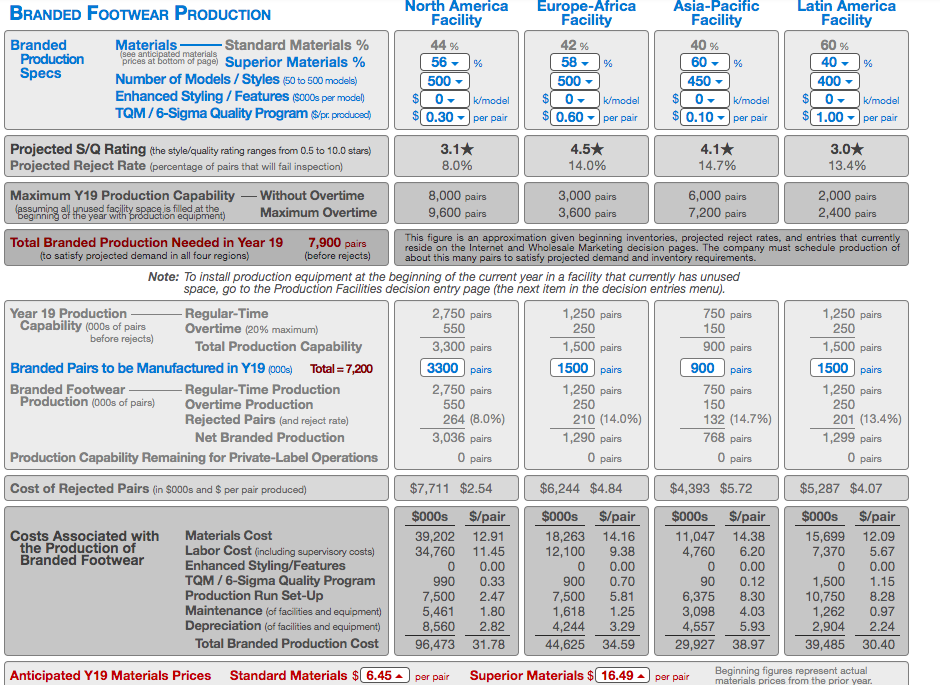
Quality of our shoes was relatively comparable to that of the other companies
-
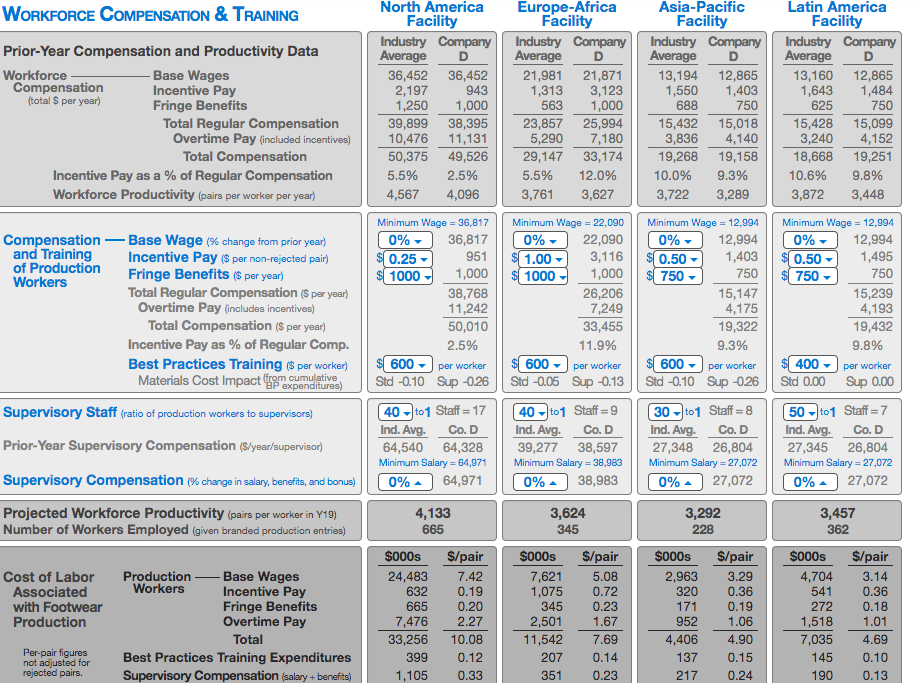
Higher level of employee loyalty due to relatively high salaries compared to other companies
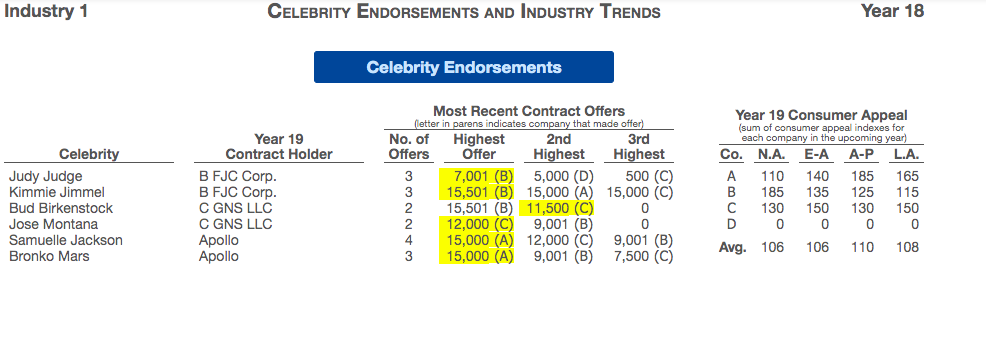
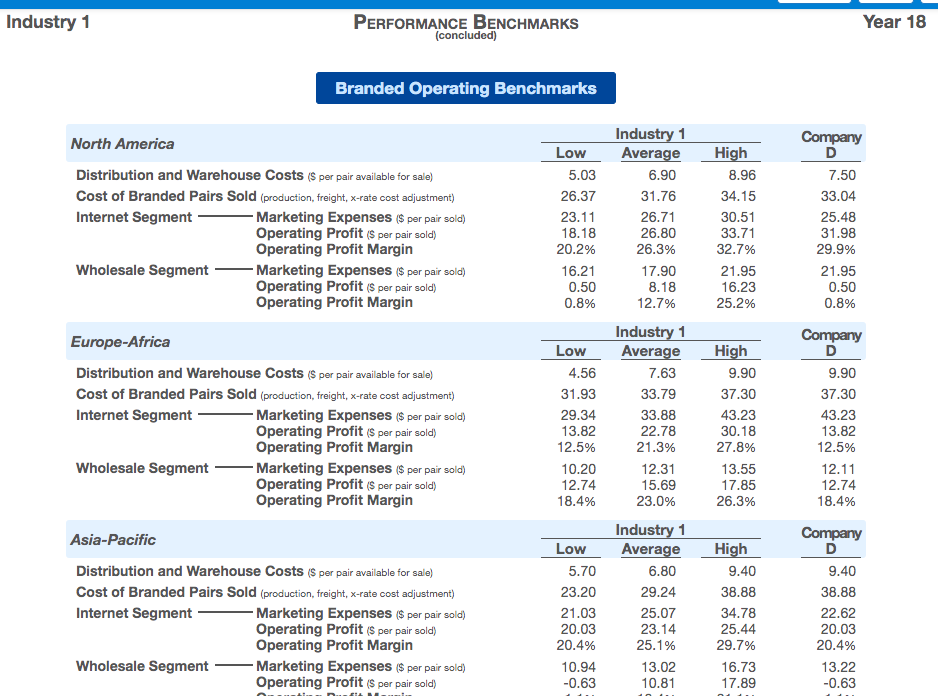
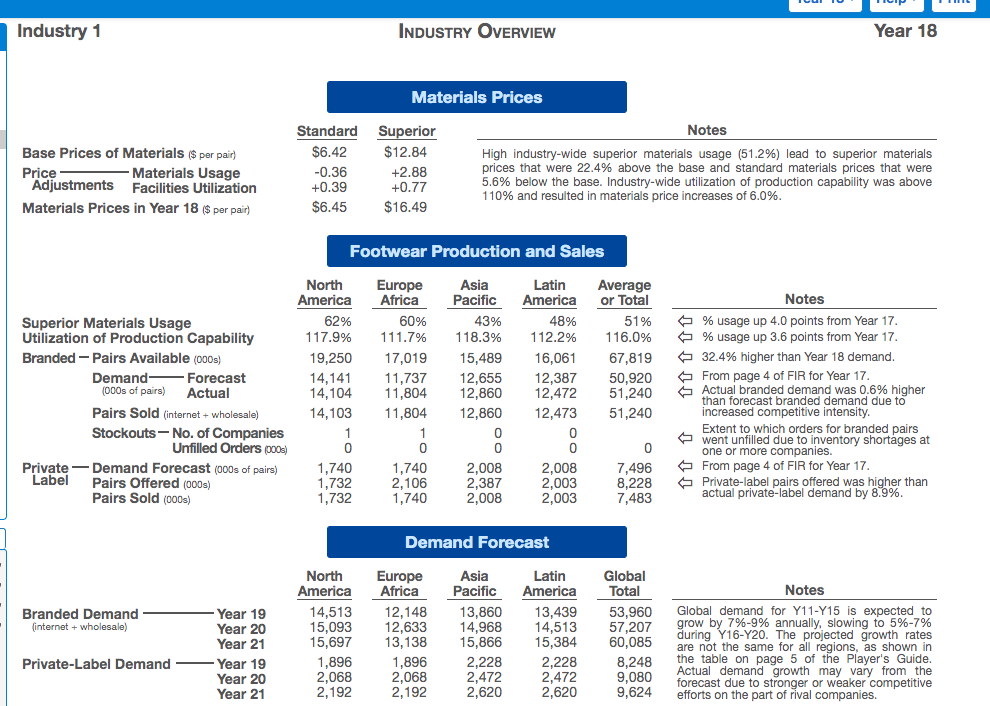
BRANDED DISTRIBUTION Latin America Facility North America Facility 3,036 pairs 1497 915 625 Pairs Available for Shipment (000s of pairs produced at each facility after rejects) Pairs to be shipped North America Warehouse from Facility to Europe-Africa Warehouse (000s of pairs) Asia-Pacific Warehouse Latin America Warehouse Remaining Pairs to be shipped (if left unshipped, will be shipped automatically) Europe-Africa Facility 1,290 pairs 2 776 102 413 Asia-Pacific Facility 768 pairs 2 1,299 pairs 200 1000 93 0 664 100 pairs -3 pairs 0 pairs 6 pairs WAREHOUSE OPERATIONS Inventory Left Over at the End of Year 18 (000s) Inventory Clearance (prior to Year 19 operations) North America Warehouse Pairs Models S/Q 207 486 2.8% 0 % O pairs $000 $/pair 0 0.00 0 0.00 0 0.00 Europe-Africa Warehouse Pairs Models S/Q 763 458 3.1* 0 % O pairs $000s S/pair 0 0.00 0 0.00 0 0.00 Asia-Pacific Warehouse || Pairs Models S/Q 173 469 3.3% 0 % O pairs $000 $/pair 0 0.00 0 0.00 0 0.00 Latin America Warehouse Pairs Models S/Q 468 413 2.9* 0 % O pairs $000s $/pair 0 0.00 0 0.00 0 0.00 Clearance Statistics Discounted Clearance Revenues Direct Cost of Pairs Cleared Margin Over Direct Cost Beginning Inventory (000s of pairs carried over from Year 18) Incoming Shipments from North America Facility (see Note 1 below) Europe-Africa Facility Asia-Pacific Facility Latin America Facility Pairs Available for Sale in Year 19 (see Note 2 below) Projected Demand (given branded marketing decision entries) Required Inventory (needed to achieve delivery time) Projected Inventory Surplus (Shortfall) Pairs Models S/Q | 207 486 2.8* 1,497 500 3.1 2 500 4.5 2 450 200 400 1,908 488 3.1* 2,151 223 (2-week delivery) -466 (minimal) Pairs Models S/Q 763 458 3.1* 915 500 3.1 776 500 4.5 2 450 4.1 1,000 400 3.0 3,456 462 3.4* 2,586 274 (2-week delivery) +596 (minimal) Pairs Models S/Q 173 469 3.3* 625 500 3.1 102 500 4.5 664 450 4.1 93 400 3.0 1,657 471 3.6* 1,634 137 (3-week delivery) -114 (minimal) Pairs Models S/Q 468 413 2.9* 2 500 3.1 413 500 4.5 100 450 4.1 0 0 0.0 983 454 3.7* 1,569 82 (3-week delivery) -668 (minimal) Projected Distribution and Warehouse Costs Exchange Rate Cost Adjustment (on incoming shipments) Distribution and Freight on Footwear Shipments Warehouse Tariffs on Pairs Imported Costs Inventory Storage (on Y18 inventory) Packaging / Shipping (Net + wholesale) Warehouse Lease / Maintenance Total Dist. and Whse. Costs $000s -1,140 1,997 614 104 11,037 1,000 14,752 $/pair -0.60 1.05 0.32 0.05 5.78 0.52 7.73 $000s -4,352 4,808 9,512 541 16,505 1,000 32,366 $/pair -1.26 1.39 2.75 0.16 4.77 0.29 9.36 $000 -577 2,402 3,905 104 8,892 1,000 16,303 $/pair -0.35 1.45 2.36 0.06 5.37 0.60 9.84 $000 3,201 1,069 4,623 350 7,494 1,000 14,536 $/pair 3.26 1.09 4.71 0.36 7.63 1.02 14.80 Offer Priority CELEBRITY ENDORSEMENT CONTRACTS Contract Terminate Available Appeal Indexes Amount Contract Contract for Celebrity N.A. E-A A-P L.A. Currently signed By ($000s / yr.) Early Length Offer Judy Judge 85 65 60 40 B FJC Corp. 7,001 2 years NOW Kimmie Jimmel 100 70 65 75 BFJC Corp. 15,501 2 years NOW Bud Birkenstock 70 100 70 55 C GNS LLC 11,500 2 years NOW Jose Montana 60 50 60 95 CGNS LLC 12,000 2 years NOW Samuelle Jackson 50 95 85 100 Apollo 15,000 3 years Year 20 Bronko Mars 60 45 100 65 Apollo 15,000 3 years Year 20 Spending Cap on Year 19 Contracts ($000s) $10 When the total annual cost of the company's winning Year 19 contract offers Contract Offer $000s / yr.) $ 10 $ 10 $10 $10 $0 Sum of Year 19 reaches this dollar amount, all remaining lower-priority offers will be withdrawn. contract offers. Most Recent Contract Offers (letter in parentheses indicated company that made the offer) No. of Highest 2nd Celebrity Offers Offer Highest Judy Judge 7,001 (B) 5,000 (D) Kimmie Jimmel 15,501 (B) 15,000 (A) Bud Birkenstock 15,501 (8) 11,500 (C) Jose Montana 12,000 (C) 9,001 (B) Samuelle Jackson 15,000 (A) 12,000 (C) Bronko Mars 15,000 (A) 9,001 (B) 3rd Highest 500 (0) 15,000 (C) 9,001 (B) 7,500 (C) Enter all contract offers in thousands of dollars per year. For example, enter an offer of $2.5 million as 2500. The minimum annual contract offer is $500k (entered as 500). A contract offer entry of $0 for a given celebrity indicates that the celebrity will receive no offer. The maximum annual contract offer is $30 million (entered as 30000). In a given year, offers may be made to as many celebrities as are available, however a company will be awarded no more than 3 celebrity contracts in the same year. When making offers to multiple celebrities in the same year, it is recom- mended that you prioritize the offers and set a spending cap for the year (to guard against winning more contracts than intended). In a given region, the maximum affective celebrity appeal total is 300. When the sum of the appeal indexes in a given region reaches 300, no additional market impact is gained by signing more celebrities. BRANDED FOOTWEAR PRODUCTION North America Facility Europe-Africa Facility Asia-Pacific Facility Latin America Facility 44 see anticipated materials Branded Production Specs 60% ( 40- % % Materials Standard Materials % prices at bottom of page) Superior Materials % Number of Models / Styles (50 to 500 models) Enhanced Styling / Features (5000s per model TQM / 6-Sigma Quality Program $/pr. produced | 56 500 $ 0 $(0.30 42% ( 58 - % 500-1 $ 0 k/model $ 0.60 per pair 40% 60 % 450 - $[ 0 k/model $0.10 - per pair 400 k/model per pair $ 0 $ 1.00 k/model per pair Projected S/Q Rating (the style/quality rating ranges from 0.5 to 10.0 stars) Projected Reject Rate (percentage of pairs that will fail inspection) 3.1* 8.0% 4.5% 14.0% 4.1* 14.7% 3.0* 13.4% Maximum Y19 Production Capability Without Overtime Begunning at the year facility presented attent) Maximum Overtime 8,000 pairs 9,600 pairs 3,000 pairs 3,600 pairs 6,000 pairs 7,200 pairs 2,000 pairs 2.400 pairs beginning of the year with production equipment Total Branded Production Needed in Year 197,900 pairs This figure is an approximation given beginning inventories, projected reject rates, and entries that currently reside on the Internet and Wholesale Marketing decision pages. The company must schedule production of to satisfy projected demand in all four regions) (before rejects) about this many pairs to satisfy projected demand and inventory requirements. Note: To install production equipment at the beginning of the current year in a facility that currently has unused space, go to the Production Facilities decision entry page (the next item in the decision entries menu). Year 19 Production - -Regular-Time Capability (000s of pairs Overtime (20% maximum) before rejects) Total Production Capability Branded Pairs to be Manufactured in Y19 (000) Total = 7,200 Branded Footwear - Regular-Time Production Production (000s of pairs) Overtime Production Rejected Pairs (and reject rate) Net Branded Production Production Capability Remaining for Private-Label Operations 2,750 pairs 550 3,300 pairs 3300 pairs 2,750 pairs 550 264 (8.0%) 3,036 pairs O pairs 1,250 pairs 250 1,500 pairs 1500 pairs 1,250 pairs 250 210 (14.0%) 1,290 pairs O pairs 750 pairs 150 900 pairs 900 pairs 750 pairs 150 132 (14.7%) 768 pairs O pairs 1,250 pairs 250 1,500 pairs 1500 pairs 1,250 pairs 250 201 (13.4%) 1,299 pairs O pairs Cost of Rejected Pairs (in $000s and $ per pair produced) $7,711 $2.54 $6,244 $4.84 $4,393 $5.72 $5,287 $4.07 Costs Associated with the Production of Branded Footwear Materials Cost Labor Cost (including supervisory costs) Enhanced Styling/Features TQM / 6-Sigma Quality Program Production Run Set-Up Maintenance of facilities and equipment) Depreciation (of facilities and equipment) Total Branded Production Cost $000s 39,202 34,760 0 990 7,500 5,461 8,560 96,473 $/pair 12.91 11.45 0.00 0.33 2.47 1.80 2.82 31.78 $000s 18,263 12,100 0 900 7,500 1,618 4,244 44,625 $/pair 14.16 9.38 0.00 0.70 5.81 1.25 3.29 34.59 $000s 11,047 4,760 0 90 6,375 3,098 4,557 29,927 $/pair 14.38 6.20 0.00 0.12 8.30 4.03 5.93 38.97 $000s 15,699 7,370 0 1,500 10.750 1,262 2,904 39,485 $/pair 12.09 5.67 0.00 1.15 8.28 0.97 2.24 30.40 Anticipated Y19 Materials Prices Standard Materials $ 6.45 per pair Superior Materials $ 16.49 per pair Beginning to reprenatuan WORKFORCE COMPENSATION & TRAINING Prior-Year Compensation and Productivity Data Workforce Base Wages Compensation Incentive Pay (total $ per year) Fringe Benefits Total Regular Compensation Overtime Pay (included incentives) Total Compensation Incentive Pay as a % of Regular Compensation Workforce Productivity (pairs per worker per year) North America Facility Industry Company Average D 36,452 36,452 2,197 943 1,250 1,000 39,899 38,395 10,476 11,131 50,375 49,526 5.5% 2.5% 4,567 4,096 Europe-Africa Facility Industry Company Average D 21,981 21,871 1,313 3,123 563 1,000 23,857 25,994 5,290 7,180 29,147 33,174 5.5% 12.0% 3,761 3,627 Asia-Pacific Facility Industry Company Average D 13,194 12,865 1,550 1,403 688 750 15,432 15,018 3,836 4,140 19,268 19,158 10.0% 9.3% 3,722 3,289 Latin America Facility Industry Company Average D 13,160 12,865 1,643 1,484 625 750 15,428 15,099 3,240 4,152 18,668 19,251 10.6% 9.8% 3,872 3,448 Compensation - Base Wage (% change from prior year) and Training Incentive Pay ($ per non-rejected pair) of Production Fringe Benefits ($ per year) Workers Total Regular Compensation ($ per year) Overtime Pay (includes incentives) Total Compensation ($ per year) Incentive Pay as % of Regular Comp. Best Practices Training ($ per worker) Materials Cost Impact (from cumulative pact BP expenditures) Minimum Wage = 36,817 0% 36,817 $ 0.25 951 $(1000 1,000 38,768 11,242 50,010 2.5% $ 600 - ) per worker Std -0.10 Sup -0.26 (40 to1 Staff = 17 Ind. Avg. Co.D 64,540 64,328 Minimum Salary = 64,971 0% 64,971 Minimum Wage = 22,090 (0% ) 22,090 $1.00 - 3,116 ${1000 1,000 26,206 7,249 33,455 11.9% $( 600 - ) per worker Std -0.05 Sup -0.13 40 01 Staff = 9 Ind. Avg. Co. D 39,277 38,597 Minimum Salary = 38,983 0% 38,983 Minimum Wage = 12,994 0% 12,994 $0.50 $ 750 750 15,147 4,175 19,322 9.3% $ 600 - per worker Std -0.10 Sup -0.26 30-01 Staff = 8 Ind. Avg. Co. D 27,348 26,804 Minimum Salary = 27,072 0% 27,072 Minimum Wage = 12,994 0% 12,994 $0.50 - 1,495 $( 750 ) 750 15,239 4,193 19,432 9.8% $ 400 - ) per worker Std 0.00 Sup 0.00 Supervisory Staff (ratio of production workers to supervisors) Prior-Year Supervisory Compensation ($/year/supervisor) 50 - 01 Staff = 7 Ind. Avg. Co.D 27,345 26,804 Minimum Salary = 27,072 0% 27,072 Supervisory Compensation (% change in salary, benefits, and bonus) Projected Workforce Productivity (pairs per worker in Y19) Number of Workers Employed (given branded production entries) 4,133 665 3,624 345 3,292 228 3,457 362 $/pair Cost of Labor Associated with Footwear Production Production Base Wages Workers Incentive Pay Fringe Benefits Overtime Pay Total Best Practices Training Expenditures Supervisory Compensation (salary + benefits) $000s 24,483 632 665 7,476 33,256 399 1,105 $/pair 7.42 0.19 0.20 2.27 10.08 0.12 0.33 $000s 7,621 1,075 345 2,501 11,542 207 351 $000s 2,963 320 171 952 4,406 137 217 $/pair 3.29 0.36 0.19 1.06 4.90 0.15 0.24 $000s 4,704 541 272 1,518 7,035 145 190 $/pair 3.14 0.36 0.18 1.01 4.69 0.10 0.13 Per-pair figures not adjusted for rejected pairs. 1.67 7.69 0.14 0.23 Industry 1 CELEBRITY ENDORSEMENTS AND INDUSTRY TRENDS Year 18 Celebrity Endorsements Celebrity Judy Judge Kimmie Jimmel Bud Birkenstock Jose Montana Samuelle Jackson Bronko Mars Year 19 Contract Holder B FJC Corp. B FJC Corp. C GNS LLC C GNS LLC Apollo Apollo Most Recent Contract Offers (letter in parens indicates company that made offer) No. of Highest 2nd 3rd Offers Offer Highest Highest 7,001 (B) 5,000 (D) 500 (C) 15,501 (B) 15,000 (A) 15,000 (C) 15,501 (B) 11,500 (C) 12,000 (C) 9,001 (B) 15,000 (A) 12,000 (C) 9,001 (B) 15,000 (A) 9,001 (B) 7,500 (C) Year 19 Consumer Appeal (sum of consumer appeal indexes for each company in the upcoming year) Co. N.A. E-A A- PL.A. A 110 140 185 165 B 185 135 125 115 C 130 150 130 150 D 0 0 0 0 Avg. 106 106 110 108 WANNW Industry 1 PERFORMANCE BENCHMARKS (concluded) Year 18 Branded Operating Benchmarks North America Industry 1 Average 6.90 31.76 Distribution and Warehouse Costs S per pair available for sale) Cost of Branded Pairs Sold (production, freight, x-rate cost adjustment) Internet Segment - - Marketing Expenses $ per pair sold) Operating Profit (s per pair sold) Operating Profit Margin Wholesale Segment Marketing Expenses ($ per pair sold) Operating Profit (s per pair sold) Operating Profit Margin Low 5.03 26.37 23.11 18.18 20.2% 16.21 0.50 0.8% 26.71 26.80 26.3% 17.90 8.18 12.7% High 8.96 34.15 30.51 33.71 32.7% 21.95 16.23 25.2% Company D 7.50 33.04 25.48 31.98 29.9% 21.95 0.50 0.8% Europe-Africa Company Distribution and Warehouse Costs (per pair available for sale) Cost of Branded Pairs Sold (production, freight, x-rate cost adjustment) Internet Segment - Marketing Expenses ($ per pair sold) Operating Profit ($ per pair sold) Operating Profit Margin Wholesale Segment - Marketing Expenses ($ per pair sold) Operating Profit (s per pair sold) Operating Profit Margin Low 4.56 31.93 29.34 13.82 12.5% 10.20 12.74 18.4% Industry 1 Average 7.63 33.79 33.88 22.78 21.3% 12.31 15.69 23.0% High 9.90 37.30 43.23 30.18 27.8% 13.55 17.85 26.3% 9.90 37.30 43.23 13.82 12.5% 12.11 12.74 18.4% Asia-Pacific Company D Low 5.70 23.20 Distribution and Warehouse Costs ($ per pair available for sale) Cost of Branded Pairs Sold (production, freight, x-rate cost adjustment) Internet Segment - Marketing Expenses ($ per pair sold) Operating Profit (s per pair sold) Operating Profit Margin Wholesale Segment - Marketing Expenses $ per pair sold) Operating Profit (s per pair sold) 21.03 20.03 20.4% 10.94 -0.63 Industry 1 Average 6.80 29.24 25.07 23.14 25.1% 13.02 10.81 High 9.40 38.88 34.78 25.44 29.7% 16.73 17.89 9.40 38.88 22.62 20.03 20.4% 13.22 -0.63 TICIPAL Industry 1 INDUSTRY OVERVIEW Year 18 Materials Prices Notes Base Prices of Materials ($ per pair) Price Materials Usage Adjustments Facilities Utilization Materials Prices in Year 18 ($ per pair) Standard $6.42 -0.36 +0.39 $6.45 Superior $12.84 +2.88 +0.77 $16.49 High industry-wide superior materials usage (51.2%) lead to superior materials prices that were 22.4% above the base and standard materials prices that were 5.6% below the base. Industry-wide utilization of production capability was above 110% and resulted in materials price increases of 6.0%. Footwear Production and Sales Asia Pacific Superior Materials Usage Utilization of Production Capability Branded-Pairs Available (000s) Demand Forecast (000s of pairs) Actual Pairs Sold (internet + wholesale) Stockouts-No. of Companies Unfilled Orders (000) Private Demand Forecast (000s of pairs) Label Pairs Offered (000s) Pairs Sold (000s) North America 62% 117.9% 19,250 14,141 14,104 14,103 Europe Africa 60% 111.7% 17,019 11,737 11,804 11,804 118.3% 15,489 12,655 12,860 12,860 Latin America 48% 112.2% 16,061 12,387 12,472 12,473 0 Average or Total 51% 116.0% 67,819 50,920 51,240 51,240 Notes % usage up 4.0 points from Year 17. % usage up 3.6 points from Year 17. 32.4% higher than Year 18 demand. From page 4 of FIR for Year 17. Actual branded demand was 0.6% higher than forecast branded demand due to increased competitive intensity. Extent to which orders for branded pairs went unfilled due to inventory shortages at one or more companies. From page 4 of FIR for Year 17. Private-label pairs offered was higher than actual private-label demand by 8.9%. 1,740 1,732 1,732 0 1,740 2,106 1,740 2,008 2,387 2,008 2,008 2,003 2,003 7,496 8,228 7,483 Demand Forecast Branded Demand internet + wholesale) Year 19 Year 20 Year 21 -Year 19 Year 20 Year 21 North America 14,513 15,093 15,697 1,896 2,068 2,192 Europe Africa 12,148 12,633 13,138 1,896 2,068 2,192 Asia Pacific 13,860 14,968 15,866 2,228 2,472 2,620 Latin America 13,439 14,513 15,384 2,228 2,472 2,620 Global Total 53,960 57,207 60,085 8,248 9,080 9,624 Notes Global demand for Y11-Y15 is expected to grow by 7%-9% annually, slowing to 5%-7% during Y16-Y20. The projected growth rates are not the same for all regions, as shown in the table on page 5 of the player's Guide. Actual demand growth may vary from the forecast due to stronger or weaker competitive efforts on the part of rival companies. Private-Label Demand BRANDED DISTRIBUTION Latin America Facility North America Facility 3,036 pairs 1497 915 625 Pairs Available for Shipment (000s of pairs produced at each facility after rejects) Pairs to be shipped North America Warehouse from Facility to Europe-Africa Warehouse (000s of pairs) Asia-Pacific Warehouse Latin America Warehouse Remaining Pairs to be shipped (if left unshipped, will be shipped automatically) Europe-Africa Facility 1,290 pairs 2 776 102 413 Asia-Pacific Facility 768 pairs 2 1,299 pairs 200 1000 93 0 664 100 pairs -3 pairs 0 pairs 6 pairs WAREHOUSE OPERATIONS Inventory Left Over at the End of Year 18 (000s) Inventory Clearance (prior to Year 19 operations) North America Warehouse Pairs Models S/Q 207 486 2.8% 0 % O pairs $000 $/pair 0 0.00 0 0.00 0 0.00 Europe-Africa Warehouse Pairs Models S/Q 763 458 3.1* 0 % O pairs $000s S/pair 0 0.00 0 0.00 0 0.00 Asia-Pacific Warehouse || Pairs Models S/Q 173 469 3.3% 0 % O pairs $000 $/pair 0 0.00 0 0.00 0 0.00 Latin America Warehouse Pairs Models S/Q 468 413 2.9* 0 % O pairs $000s $/pair 0 0.00 0 0.00 0 0.00 Clearance Statistics Discounted Clearance Revenues Direct Cost of Pairs Cleared Margin Over Direct Cost Beginning Inventory (000s of pairs carried over from Year 18) Incoming Shipments from North America Facility (see Note 1 below) Europe-Africa Facility Asia-Pacific Facility Latin America Facility Pairs Available for Sale in Year 19 (see Note 2 below) Projected Demand (given branded marketing decision entries) Required Inventory (needed to achieve delivery time) Projected Inventory Surplus (Shortfall) Pairs Models S/Q | 207 486 2.8* 1,497 500 3.1 2 500 4.5 2 450 200 400 1,908 488 3.1* 2,151 223 (2-week delivery) -466 (minimal) Pairs Models S/Q 763 458 3.1* 915 500 3.1 776 500 4.5 2 450 4.1 1,000 400 3.0 3,456 462 3.4* 2,586 274 (2-week delivery) +596 (minimal) Pairs Models S/Q 173 469 3.3* 625 500 3.1 102 500 4.5 664 450 4.1 93 400 3.0 1,657 471 3.6* 1,634 137 (3-week delivery) -114 (minimal) Pairs Models S/Q 468 413 2.9* 2 500 3.1 413 500 4.5 100 450 4.1 0 0 0.0 983 454 3.7* 1,569 82 (3-week delivery) -668 (minimal) Projected Distribution and Warehouse Costs Exchange Rate Cost Adjustment (on incoming shipments) Distribution and Freight on Footwear Shipments Warehouse Tariffs on Pairs Imported Costs Inventory Storage (on Y18 inventory) Packaging / Shipping (Net + wholesale) Warehouse Lease / Maintenance Total Dist. and Whse. Costs $000s -1,140 1,997 614 104 11,037 1,000 14,752 $/pair -0.60 1.05 0.32 0.05 5.78 0.52 7.73 $000s -4,352 4,808 9,512 541 16,505 1,000 32,366 $/pair -1.26 1.39 2.75 0.16 4.77 0.29 9.36 $000 -577 2,402 3,905 104 8,892 1,000 16,303 $/pair -0.35 1.45 2.36 0.06 5.37 0.60 9.84 $000 3,201 1,069 4,623 350 7,494 1,000 14,536 $/pair 3.26 1.09 4.71 0.36 7.63 1.02 14.80 Offer Priority CELEBRITY ENDORSEMENT CONTRACTS Contract Terminate Available Appeal Indexes Amount Contract Contract for Celebrity N.A. E-A A-P L.A. Currently signed By ($000s / yr.) Early Length Offer Judy Judge 85 65 60 40 B FJC Corp. 7,001 2 years NOW Kimmie Jimmel 100 70 65 75 BFJC Corp. 15,501 2 years NOW Bud Birkenstock 70 100 70 55 C GNS LLC 11,500 2 years NOW Jose Montana 60 50 60 95 CGNS LLC 12,000 2 years NOW Samuelle Jackson 50 95 85 100 Apollo 15,000 3 years Year 20 Bronko Mars 60 45 100 65 Apollo 15,000 3 years Year 20 Spending Cap on Year 19 Contracts ($000s) $10 When the total annual cost of the company's winning Year 19 contract offers Contract Offer $000s / yr.) $ 10 $ 10 $10 $10 $0 Sum of Year 19 reaches this dollar amount, all remaining lower-priority offers will be withdrawn. contract offers. Most Recent Contract Offers (letter in parentheses indicated company that made the offer) No. of Highest 2nd Celebrity Offers Offer Highest Judy Judge 7,001 (B) 5,000 (D) Kimmie Jimmel 15,501 (B) 15,000 (A) Bud Birkenstock 15,501 (8) 11,500 (C) Jose Montana 12,000 (C) 9,001 (B) Samuelle Jackson 15,000 (A) 12,000 (C) Bronko Mars 15,000 (A) 9,001 (B) 3rd Highest 500 (0) 15,000 (C) 9,001 (B) 7,500 (C) Enter all contract offers in thousands of dollars per year. For example, enter an offer of $2.5 million as 2500. The minimum annual contract offer is $500k (entered as 500). A contract offer entry of $0 for a given celebrity indicates that the celebrity will receive no offer. The maximum annual contract offer is $30 million (entered as 30000). In a given year, offers may be made to as many celebrities as are available, however a company will be awarded no more than 3 celebrity contracts in the same year. When making offers to multiple celebrities in the same year, it is recom- mended that you prioritize the offers and set a spending cap for the year (to guard against winning more contracts than intended). In a given region, the maximum affective celebrity appeal total is 300. When the sum of the appeal indexes in a given region reaches 300, no additional market impact is gained by signing more celebrities. BRANDED FOOTWEAR PRODUCTION North America Facility Europe-Africa Facility Asia-Pacific Facility Latin America Facility 44 see anticipated materials Branded Production Specs 60% ( 40- % % Materials Standard Materials % prices at bottom of page) Superior Materials % Number of Models / Styles (50 to 500 models) Enhanced Styling / Features (5000s per model TQM / 6-Sigma Quality Program $/pr. produced | 56 500 $ 0 $(0.30 42% ( 58 - % 500-1 $ 0 k/model $ 0.60 per pair 40% 60 % 450 - $[ 0 k/model $0.10 - per pair 400 k/model per pair $ 0 $ 1.00 k/model per pair Projected S/Q Rating (the style/quality rating ranges from 0.5 to 10.0 stars) Projected Reject Rate (percentage of pairs that will fail inspection) 3.1* 8.0% 4.5% 14.0% 4.1* 14.7% 3.0* 13.4% Maximum Y19 Production Capability Without Overtime Begunning at the year facility presented attent) Maximum Overtime 8,000 pairs 9,600 pairs 3,000 pairs 3,600 pairs 6,000 pairs 7,200 pairs 2,000 pairs 2.400 pairs beginning of the year with production equipment Total Branded Production Needed in Year 197,900 pairs This figure is an approximation given beginning inventories, projected reject rates, and entries that currently reside on the Internet and Wholesale Marketing decision pages. The company must schedule production of to satisfy projected demand in all four regions) (before rejects) about this many pairs to satisfy projected demand and inventory requirements. Note: To install production equipment at the beginning of the current year in a facility that currently has unused space, go to the Production Facilities decision entry page (the next item in the decision entries menu). Year 19 Production - -Regular-Time Capability (000s of pairs Overtime (20% maximum) before rejects) Total Production Capability Branded Pairs to be Manufactured in Y19 (000) Total = 7,200 Branded Footwear - Regular-Time Production Production (000s of pairs) Overtime Production Rejected Pairs (and reject rate) Net Branded Production Production Capability Remaining for Private-Label Operations 2,750 pairs 550 3,300 pairs 3300 pairs 2,750 pairs 550 264 (8.0%) 3,036 pairs O pairs 1,250 pairs 250 1,500 pairs 1500 pairs 1,250 pairs 250 210 (14.0%) 1,290 pairs O pairs 750 pairs 150 900 pairs 900 pairs 750 pairs 150 132 (14.7%) 768 pairs O pairs 1,250 pairs 250 1,500 pairs 1500 pairs 1,250 pairs 250 201 (13.4%) 1,299 pairs O pairs Cost of Rejected Pairs (in $000s and $ per pair produced) $7,711 $2.54 $6,244 $4.84 $4,393 $5.72 $5,287 $4.07 Costs Associated with the Production of Branded Footwear Materials Cost Labor Cost (including supervisory costs) Enhanced Styling/Features TQM / 6-Sigma Quality Program Production Run Set-Up Maintenance of facilities and equipment) Depreciation (of facilities and equipment) Total Branded Production Cost $000s 39,202 34,760 0 990 7,500 5,461 8,560 96,473 $/pair 12.91 11.45 0.00 0.33 2.47 1.80 2.82 31.78 $000s 18,263 12,100 0 900 7,500 1,618 4,244 44,625 $/pair 14.16 9.38 0.00 0.70 5.81 1.25 3.29 34.59 $000s 11,047 4,760 0 90 6,375 3,098 4,557 29,927 $/pair 14.38 6.20 0.00 0.12 8.30 4.03 5.93 38.97 $000s 15,699 7,370 0 1,500 10.750 1,262 2,904 39,485 $/pair 12.09 5.67 0.00 1.15 8.28 0.97 2.24 30.40 Anticipated Y19 Materials Prices Standard Materials $ 6.45 per pair Superior Materials $ 16.49 per pair Beginning to reprenatuan WORKFORCE COMPENSATION & TRAINING Prior-Year Compensation and Productivity Data Workforce Base Wages Compensation Incentive Pay (total $ per year) Fringe Benefits Total Regular Compensation Overtime Pay (included incentives) Total Compensation Incentive Pay as a % of Regular Compensation Workforce Productivity (pairs per worker per year) North America Facility Industry Company Average D 36,452 36,452 2,197 943 1,250 1,000 39,899 38,395 10,476 11,131 50,375 49,526 5.5% 2.5% 4,567 4,096 Europe-Africa Facility Industry Company Average D 21,981 21,871 1,313 3,123 563 1,000 23,857 25,994 5,290 7,180 29,147 33,174 5.5% 12.0% 3,761 3,627 Asia-Pacific Facility Industry Company Average D 13,194 12,865 1,550 1,403 688 750 15,432 15,018 3,836 4,140 19,268 19,158 10.0% 9.3% 3,722 3,289 Latin America Facility Industry Company Average D 13,160 12,865 1,643 1,484 625 750 15,428 15,099 3,240 4,152 18,668 19,251 10.6% 9.8% 3,872 3,448 Compensation - Base Wage (% change from prior year) and Training Incentive Pay ($ per non-rejected pair) of Production Fringe Benefits ($ per year) Workers Total Regular Compensation ($ per year) Overtime Pay (includes incentives) Total Compensation ($ per year) Incentive Pay as % of Regular Comp. Best Practices Training ($ per worker) Materials Cost Impact (from cumulative pact BP expenditures) Minimum Wage = 36,817 0% 36,817 $ 0.25 951 $(1000 1,000 38,768 11,242 50,010 2.5% $ 600 - ) per worker Std -0.10 Sup -0.26 (40 to1 Staff = 17 Ind. Avg. Co.D 64,540 64,328 Minimum Salary = 64,971 0% 64,971 Minimum Wage = 22,090 (0% ) 22,090 $1.00 - 3,116 ${1000 1,000 26,206 7,249 33,455 11.9% $( 600 - ) per worker Std -0.05 Sup -0.13 40 01 Staff = 9 Ind. Avg. Co. D 39,277 38,597 Minimum Salary = 38,983 0% 38,983 Minimum Wage = 12,994 0% 12,994 $0.50 $ 750 750 15,147 4,175 19,322 9.3% $ 600 - per worker Std -0.10 Sup -0.26 30-01 Staff = 8 Ind. Avg. Co. D 27,348 26,804 Minimum Salary = 27,072 0% 27,072 Minimum Wage = 12,994 0% 12,994 $0.50 - 1,495 $( 750 ) 750 15,239 4,193 19,432 9.8% $ 400 - ) per worker Std 0.00 Sup 0.00 Supervisory Staff (ratio of production workers to supervisors) Prior-Year Supervisory Compensation ($/year/supervisor) 50 - 01 Staff = 7 Ind. Avg. Co.D 27,345 26,804 Minimum Salary = 27,072 0% 27,072 Supervisory Compensation (% change in salary, benefits, and bonus) Projected Workforce Productivity (pairs per worker in Y19) Number of Workers Employed (given branded production entries) 4,133 665 3,624 345 3,292 228 3,457 362 $/pair Cost of Labor Associated with Footwear Production Production Base Wages Workers Incentive Pay Fringe Benefits Overtime Pay Total Best Practices Training Expenditures Supervisory Compensation (salary + benefits) $000s 24,483 632 665 7,476 33,256 399 1,105 $/pair 7.42 0.19 0.20 2.27 10.08 0.12 0.33 $000s 7,621 1,075 345 2,501 11,542 207 351 $000s 2,963 320 171 952 4,406 137 217 $/pair 3.29 0.36 0.19 1.06 4.90 0.15 0.24 $000s 4,704 541 272 1,518 7,035 145 190 $/pair 3.14 0.36 0.18 1.01 4.69 0.10 0.13 Per-pair figures not adjusted for rejected pairs. 1.67 7.69 0.14 0.23 Industry 1 CELEBRITY ENDORSEMENTS AND INDUSTRY TRENDS Year 18 Celebrity Endorsements Celebrity Judy Judge Kimmie Jimmel Bud Birkenstock Jose Montana Samuelle Jackson Bronko Mars Year 19 Contract Holder B FJC Corp. B FJC Corp. C GNS LLC C GNS LLC Apollo Apollo Most Recent Contract Offers (letter in parens indicates company that made offer) No. of Highest 2nd 3rd Offers Offer Highest Highest 7,001 (B) 5,000 (D) 500 (C) 15,501 (B) 15,000 (A) 15,000 (C) 15,501 (B) 11,500 (C) 12,000 (C) 9,001 (B) 15,000 (A) 12,000 (C) 9,001 (B) 15,000 (A) 9,001 (B) 7,500 (C) Year 19 Consumer Appeal (sum of consumer appeal indexes for each company in the upcoming year) Co. N.A. E-A A- PL.A. A 110 140 185 165 B 185 135 125 115 C 130 150 130 150 D 0 0 0 0 Avg. 106 106 110 108 WANNW Industry 1 PERFORMANCE BENCHMARKS (concluded) Year 18 Branded Operating Benchmarks North America Industry 1 Average 6.90 31.76 Distribution and Warehouse Costs S per pair available for sale) Cost of Branded Pairs Sold (production, freight, x-rate cost adjustment) Internet Segment - - Marketing Expenses $ per pair sold) Operating Profit (s per pair sold) Operating Profit Margin Wholesale Segment Marketing Expenses ($ per pair sold) Operating Profit (s per pair sold) Operating Profit Margin Low 5.03 26.37 23.11 18.18 20.2% 16.21 0.50 0.8% 26.71 26.80 26.3% 17.90 8.18 12.7% High 8.96 34.15 30.51 33.71 32.7% 21.95 16.23 25.2% Company D 7.50 33.04 25.48 31.98 29.9% 21.95 0.50 0.8% Europe-Africa Company Distribution and Warehouse Costs (per pair available for sale) Cost of Branded Pairs Sold (production, freight, x-rate cost adjustment) Internet Segment - Marketing Expenses ($ per pair sold) Operating Profit ($ per pair sold) Operating Profit Margin Wholesale Segment - Marketing Expenses ($ per pair sold) Operating Profit (s per pair sold) Operating Profit Margin Low 4.56 31.93 29.34 13.82 12.5% 10.20 12.74 18.4% Industry 1 Average 7.63 33.79 33.88 22.78 21.3% 12.31 15.69 23.0% High 9.90 37.30 43.23 30.18 27.8% 13.55 17.85 26.3% 9.90 37.30 43.23 13.82 12.5% 12.11 12.74 18.4% Asia-Pacific Company D Low 5.70 23.20 Distribution and Warehouse Costs ($ per pair available for sale) Cost of Branded Pairs Sold (production, freight, x-rate cost adjustment) Internet Segment - Marketing Expenses ($ per pair sold) Operating Profit (s per pair sold) Operating Profit Margin Wholesale Segment - Marketing Expenses $ per pair sold) Operating Profit (s per pair sold) 21.03 20.03 20.4% 10.94 -0.63 Industry 1 Average 6.80 29.24 25.07 23.14 25.1% 13.02 10.81 High 9.40 38.88 34.78 25.44 29.7% 16.73 17.89 9.40 38.88 22.62 20.03 20.4% 13.22 -0.63 TICIPAL Industry 1 INDUSTRY OVERVIEW Year 18 Materials Prices Notes Base Prices of Materials ($ per pair) Price Materials Usage Adjustments Facilities Utilization Materials Prices in Year 18 ($ per pair) Standard $6.42 -0.36 +0.39 $6.45 Superior $12.84 +2.88 +0.77 $16.49 High industry-wide superior materials usage (51.2%) lead to superior materials prices that were 22.4% above the base and standard materials prices that were 5.6% below the base. Industry-wide utilization of production capability was above 110% and resulted in materials price increases of 6.0%. Footwear Production and Sales Asia Pacific Superior Materials Usage Utilization of Production Capability Branded-Pairs Available (000s) Demand Forecast (000s of pairs) Actual Pairs Sold (internet + wholesale) Stockouts-No. of Companies Unfilled Orders (000) Private Demand Forecast (000s of pairs) Label Pairs Offered (000s) Pairs Sold (000s) North America 62% 117.9% 19,250 14,141 14,104 14,103 Europe Africa 60% 111.7% 17,019 11,737 11,804 11,804 118.3% 15,489 12,655 12,860 12,860 Latin America 48% 112.2% 16,061 12,387 12,472 12,473 0 Average or Total 51% 116.0% 67,819 50,920 51,240 51,240 Notes % usage up 4.0 points from Year 17. % usage up 3.6 points from Year 17. 32.4% higher than Year 18 demand. From page 4 of FIR for Year 17. Actual branded demand was 0.6% higher than forecast branded demand due to increased competitive intensity. Extent to which orders for branded pairs went unfilled due to inventory shortages at one or more companies. From page 4 of FIR for Year 17. Private-label pairs offered was higher than actual private-label demand by 8.9%. 1,740 1,732 1,732 0 1,740 2,106 1,740 2,008 2,387 2,008 2,008 2,003 2,003 7,496 8,228 7,483 Demand Forecast Branded Demand internet + wholesale) Year 19 Year 20 Year 21 -Year 19 Year 20 Year 21 North America 14,513 15,093 15,697 1,896 2,068 2,192 Europe Africa 12,148 12,633 13,138 1,896 2,068 2,192 Asia Pacific 13,860 14,968 15,866 2,228 2,472 2,620 Latin America 13,439 14,513 15,384 2,228 2,472 2,620 Global Total 53,960 57,207 60,085 8,248 9,080 9,624 Notes Global demand for Y11-Y15 is expected to grow by 7%-9% annually, slowing to 5%-7% during Y16-Y20. The projected growth rates are not the same for all regions, as shown in the table on page 5 of the player's Guide. Actual demand growth may vary from the forecast due to stronger or weaker competitive efforts on the part of rival companies. Private-Label Demand