Answered step by step
Verified Expert Solution
Link Copied!

Question

1 Approved Answer

Display it using matlab For the following two-variable function: z = 2x sin(x) + xy cos(2y) i. Plot a 3D mesh for z, for the
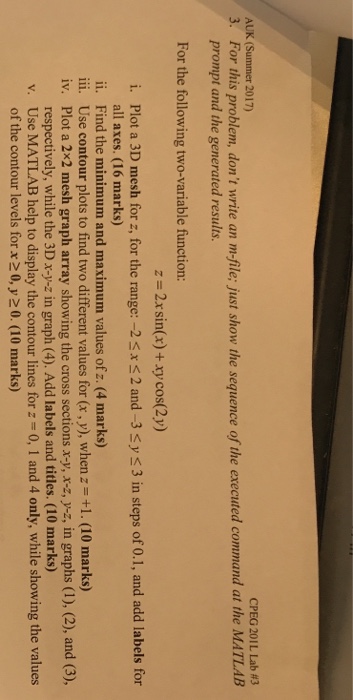
image text in transcribed Display it using matlab
For the following two-variable function: z = 2x sin(x) + xy cos(2y) i. Plot a 3D mesh for z, for the range: -2 lessthanorequalto x lessthanorequalto 2 and -3 lessthanorequalto y lessthanorequalto 3 in steps of 0.1, and add labels for all axes. ii. Find the minimum and maximum values of z. iii. Use contour plots to find two different values for (x, y), when z- = +1. iv. Plot a 2 times 2 mesh graph array showing the cross sections x-y, x-z, y-z, in graphs (1), (2), and (3), respectively, while the 3D x-y-z in graph (4). Add labels and titles. v. Use MATLAB help to display the contour lines for z = 0, 1 and 4 only, while showing the values of the contour levels for x greaterthanorequalto 0, y greaterthanorequalto 0

Step by Step Solution

There are 3 Steps involved in it

Step: 1

blur-text-image

Get Instant Access to Expert-Tailored Solutions

See step-by-step solutions with expert insights and AI powered tools for academic success

Step: 2

blur-text-image

Step: 3

blur-text-image

Ace Your Homework with AI

Get the answers you need in no time with our AI-driven, step-by-step assistance

Get Started

Recommended Textbook for

Advances In Databases And Information Systems 14th East European Conference Adbis 2010 Novi Sad Serbia September 2010 Proceedings Lncs 6295

Authors: Barbara Catania ,Mirjana Ivanovic ,Bernhard Thalheim

2010th Edition

3642155758, 978-3642155758

Students also viewed these Databases questions

Question

7. How might you go about testing these assumptions?

Answered: 1 week ago