Answered step by step
Verified Expert Solution
Link Copied!

Question

1 Approved Answer

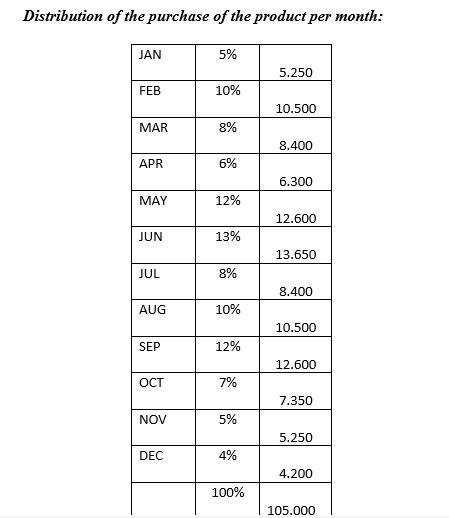
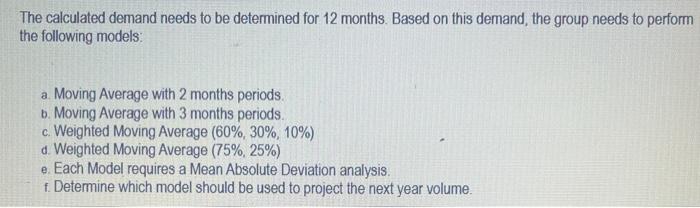
Distribution of the purchase of the product per month: begin{tabular}{|l|c|c|} hline JAN & 5% & hline FEB & 10% & 10.500 hline MAR

image text in transcribed
Distribution of the purchase of the product per month: \begin{tabular}{|l|c|c|} \hline JAN & 5% & \\ \hline FEB & 10% & 10.500 \\ \hline MAR & 8% & \\ \hline APR & 6% & 8.400 \\ \hline MAY & 12% & 6.300 \\ \hline JUN & 13% & 12.600 \\ \hline JUL & 8% & 13.650 \\ \hline AUG & 10% & 8.400 \\ \hline SEP & 12% & 10.500 \\ \hline OCT & 7% & 12.600 \\ \hline NOV & 5% & 7.350 \\ \hline DEC & 4% & 5.250 \\ \hline & 100% & 4.200 \\ \hline \end{tabular} The calculated demand needs to be determined for 12 months. Based on this demand, the group needs to perform the following models: a. Moving Average with 2 months periods. b. Moving Average with 3 months periods. c. Weighted Moving Average (60%,30%,10%) d. Weighted Moving Average (75\%, 25\%) e. Each Model requires a Mean Absolute Deviation analysis. f. Determine which model should be used to project the next year volume

Step by Step Solution

There are 3 Steps involved in it

Step: 1

blur-text-image

Get Instant Access to Expert-Tailored Solutions

See step-by-step solutions with expert insights and AI powered tools for academic success

Step: 2

blur-text-image

Step: 3

blur-text-image

Ace Your Homework with AI

Get the answers you need in no time with our AI-driven, step-by-step assistance

Get Started

Students also viewed these General Management questions

Question

How can a firm suppress problem recognition?

Answered: 1 week ago

Question

3. Why does the aggregate demand curve slope downward? LOP8

Answered: 1 week ago