

Answered step by step
Verified Expert Solution
Question
1 Approved Answer
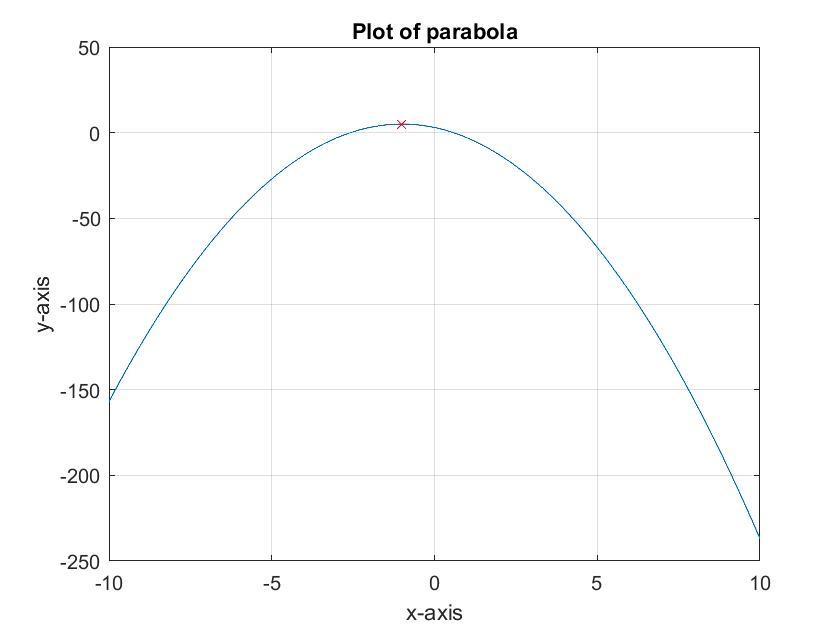
DO IN MATLAB: You need to generate the figure shown below using Matlab. Complete the code given below which generates the given figure template is
DO IN MATLAB: You need to generate the figure shown below using Matlab. Complete the code given below which generates the given figure template is belowclc; clear; close all; Define the functionf @xxx; Define the domain for plottingt ::; Plot the function against t Label the figuretitlePlot of parabola'xlabelxaxis'ylabelyaxis' Turn grid on Find the coordinates of the maximum point Plot maximum point on the same figure
Step by Step Solution
There are 3 Steps involved in it
Step: 1

Get Instant Access to Expert-Tailored Solutions
See step-by-step solutions with expert insights and AI powered tools for academic success
Step: 2

Step: 3
Ace Your Homework with AI
Get the answers you need in no time with our AI-driven, step-by-step assistance
Get Started
Logistics Lifeline Supply Chain Strategies
Authors: Ehsan Sheroy
1st Edition
7419377502, 978-7419377503