Answered step by step
Verified Expert Solution
Question
1 Approved Answer
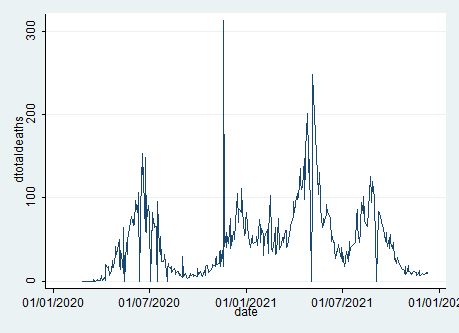
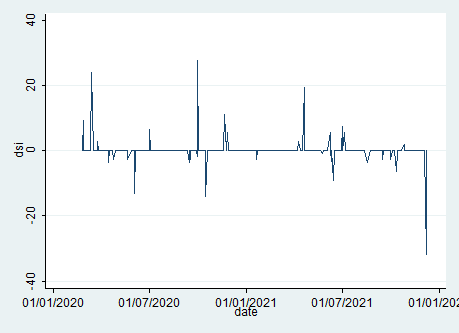
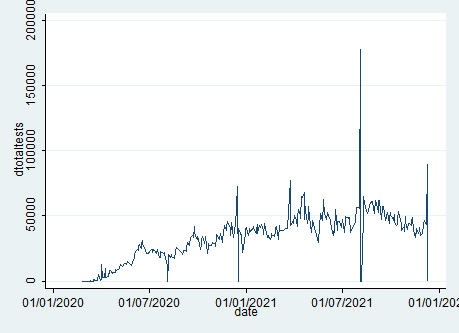
Do interpretation of following difference Line graphs from stata model. Model: Effect of covid on stock returns 1 dependent variable variable = -Stock return 4


Do interpretation of following difference Line graphs from stata model.
Model: Effect of covid on stock returns
1 dependent variable variable = -Stock return
4 Independent variables =
-dtotaltests = total no of total covid tests done 6
-dtotal deaths = total no of covid deaths
-d si= stringency index
-Positive rate = positivity rate of covid
300 200 dtotaldeaths 100 MW Whaw OL 01/01/2020 01/07/2020 01/01/2021 date 01/07/2021 01/01/202 40 20 dsi 0 -20 01/01/2020 01/07/2020 01/01/2021 date 01/07/2021 01/01/202 200000 150000 dtotaltests 100000 50000 Haar alment 01/01/2020 01/07/2020 01/01/2021 date 01/07/2021 01/01/202Step by Step Solution
There are 3 Steps involved in it
Step: 1

Get Instant Access to Expert-Tailored Solutions
See step-by-step solutions with expert insights and AI powered tools for academic success
Step: 2

Step: 3

Ace Your Homework with AI
Get the answers you need in no time with our AI-driven, step-by-step assistance
Get Started


