Answered step by step
Verified Expert Solution
Link Copied!

Question

1 Approved Answer

***** Do not delete the cells in Blue or you will delete the calculation that has been provided for you . You will enter the

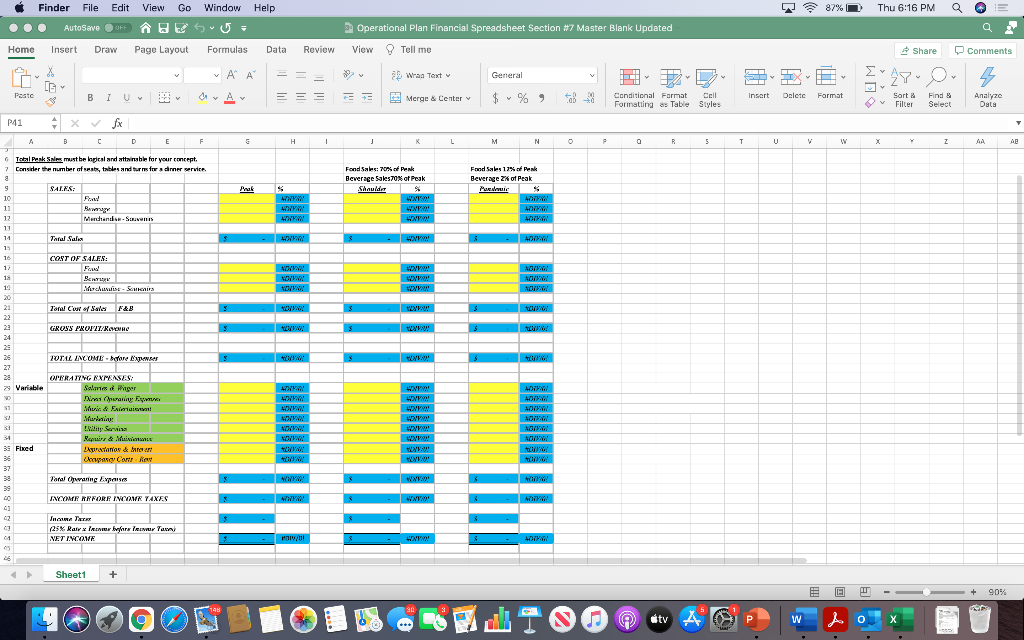
*****Do not delete the cells in Blue or you will delete the calculation that has been provided for you. You will enter the numbers in the cells that have a yellow background colour.******

  1. Financial - 3 Scenarios Peak Season, Shoulder Season, and Current Pandemic use the Industry Standards document to assist with the spreadsheet.

(THE SEATS IN OUR RESTAURNT IS 80)

  1. Complete Income Statement - Calculate profit/loss report for a month for the Peak & Shoulder Season, and Current Pandemic. Spreadsheet to show Sales/Costs/Expenses and Net Income.

Sales Totals Establish a logical prediction of sales for a month in each season Peak, Shoulder & Pandemic. Percentages of Sales (Food, Beverage, and if necessary, Merchandise) are set at an attainable value based on your restaurant concept. You must consider the number of seats and turns that you will have on average for each month of the season.

Cost of Sales accurate Cost Percentages are set at an appropriate % of Industry Standards.

Operating Expenses accurate Operating Expenses are set at an appropriate % of Industry Standards.

Net Income The Net Income Percentages are reflective of the Industry Standards and/or reflect the potential of sales according to the current season.

Industry Standards: Restaurant Financials Averages

Sales

Food Sales 75-85% of total Sales

Beverage Sales 15-25% of total Sales

Cost of Sales

Food Cost 30-40% of Food Sales

Beverage Cost 18-30% of Beverage Sales

Merchandise 3-15% of Merchandise Sales

Total Cost of Sales 28-32%

Operating Expenses

Variable Costs/Expenses

Salaries & Wages 30-35% of Total Sales

Direct Operating Expenses 3-5% of Total Sales

Music & Entertainment 0.5-2.5% of Total Sales

Marketing 6-10% of Total Sales

Utility Services 3-5% of Total Sales

Repairs & Maintenance 2-4% of Total Sales

Fixed Costs/Expenses

Depreciation & Interest 10-15% of Total Sales

Occupancy Cost Rent 2-8% of Total Sales

Total Operating Expenses 60-80% of Total Sales

Calculation: (Total Operating Expenses/Total Sales) X 100 = Total Operating Expenses %

Total Net Income

Total Net Income 3-15%

Calculation: (Total Gross Income (before Expenses) Total Operating Expenses) Taxes = Net Income

image text in transcribed

Finder File Edit View Go Window Help A 87% Thu 6:16 PM Q 000 AutoSave EU- Operational Plan Financial Spreadsheet Section #7 Master Blank Updated a Home Insert Draw Page Layout Formulas Data Review View Tell me Share Comments v P A Wran Text General SIX WE Ay. 4 V Poste BIU OA Insert $ % 9 Delete y Format Merge & Center Conditional Format Cell Formatting as Table Styles Sort Filter Find & Select Analyze Data P41 A B D E F H H L M N N P R 5 T U U W X Z AB Food Sales 12% Penk Beverage of Peak Marie Prak Fond Sales: 70% of Peak Beverage Sales70% of Peak Shaulda $ WAO 4 NO WWW Total Peak se must be paid table for your concept 7 Consider the number of abs, tables and burns for dinner service a 9 SALES: ; 10 11 BV 12 Merchandise. Strms - 11 14 Toral Sales 13 16 COST OF SALES: 17 18 10 cvitse-Samknia Total Cor of Sales F&B www.o. GROSS PROFIT/ RE 22 24 25 26 27 20TAL INCOME.core I z Variable w 11 ADI OPERAING EXPENSES: Salme Piger Dimi ( han y Muri & Eximit furtaiy: - y Serwis is finisms Duraclarion & Bear Ucapaney Carrey 31 35 Fixed 36 37 O..! Poral hearing / WWW.O 39 SNYGYIME ARRORR INCOME TAXES 02 125% Rais ir greinir Tan VET IWCOW 04 DIV/0! ! W! 43 26 Sheet1 + + 90% 198 tv X W Finder File Edit View Go Window Help A 87% Thu 6:16 PM Q 000 AutoSave EU- Operational Plan Financial Spreadsheet Section #7 Master Blank Updated a Home Insert Draw Page Layout Formulas Data Review View Tell me Share Comments v P A Wran Text General SIX WE Ay. 4 V Poste BIU OA Insert $ % 9 Delete y Format Merge & Center Conditional Format Cell Formatting as Table Styles Sort Filter Find & Select Analyze Data P41 A B D E F H H L M N N P R 5 T U U W X Z AB Food Sales 12% Penk Beverage of Peak Marie Prak Fond Sales: 70% of Peak Beverage Sales70% of Peak Shaulda $ WAO 4 NO WWW Total Peak se must be paid table for your concept 7 Consider the number of abs, tables and burns for dinner service a 9 SALES: ; 10 11 BV 12 Merchandise. Strms - 11 14 Toral Sales 13 16 COST OF SALES: 17 18 10 cvitse-Samknia Total Cor of Sales F&B www.o. GROSS PROFIT/ RE 22 24 25 26 27 20TAL INCOME.core I z Variable w 11 ADI OPERAING EXPENSES: Salme Piger Dimi ( han y Muri & Eximit furtaiy: - y Serwis is finisms Duraclarion & Bear Ucapaney Carrey 31 35 Fixed 36 37 O..! Poral hearing / WWW.O 39 SNYGYIME ARRORR INCOME TAXES 02 125% Rais ir greinir Tan VET IWCOW 04 DIV/0! ! W! 43 26 Sheet1 + + 90% 198 tv X W

Step by Step Solution

There are 3 Steps involved in it

Step: 1

blur-text-image

Get Instant Access to Expert-Tailored Solutions

See step-by-step solutions with expert insights and AI powered tools for academic success

Step: 2

blur-text-image

Step: 3

blur-text-image

Ace Your Homework with AI

Get the answers you need in no time with our AI-driven, step-by-step assistance

Get Started

Recommended Textbook for

The Cyber Attack Survival Manual

Authors: Heather Vescent ,Nick Selby

1st Edition

1681886545, 978-1681886541

More Books

Students also viewed these Finance questions

Question

How does an abstract word differ from a concrete word? [LO-4]

Answered: 1 week ago