

Answered step by step
Verified Expert Solution
Question
1 Approved Answer
do not know that Table 2: Activity Cost Pool Allocation (%) Regular Special Exhibits Exhibits Executive Director & fringe 35% 30% Director of Development &
do not know that
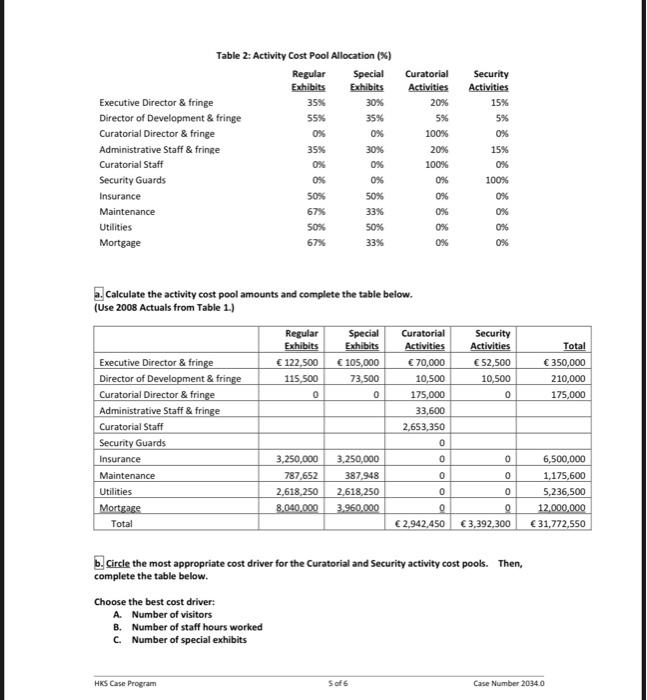
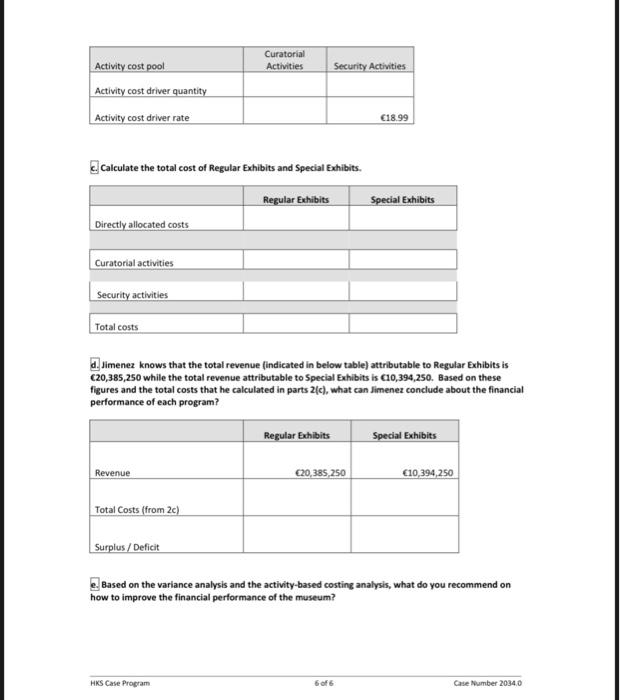
Table 2: Activity Cost Pool Allocation (%) Regular Special Exhibits Exhibits Executive Director & fringe 35% 30% Director of Development & fringe 55% 35% Curatorial Director & fringe 0% 0% Administrative Staff & fringe 35% 30% Curatorial Staff 0% Security Guards 0% Insurance 50% 50% Maintenance 67% Utilities 50% 50% Mortgage 67% Curatorial Activities 20% 5% 100% 20% 100% 0% 0% 0% 0% Security Activities 15% 5% 0% 15% 0% 100% 0% 0% 0% 888 0% 0% 0% Calculate the activity cost pool amounts and complete the table below. (Use 2008 Actuals from Table 1.) Regular Exhibits 122,500 115,500 0 Special Exhibits 105,000 73,500 0 Curatorial Activities 70,000 10,500 175,000 33,600 2,653,350 Security Activities 52,500 10,500 0 Total 350,000 210,000 175,000 Executive Director & fringe Director of Development & fringe Curatorial Director & fringe Administrative Staff & fringe Curatorial Staff Security Guards Insurance Maintenance Utilities Mortgage Total 0 0 0 0 0 3,250,000 787,652 2,618,250 8.040.000 3,250,000 387,948 2,618,250 3.960.000 0 0 0 2,942,450 3,392,300 6,500,000 1,175,600 5,236,500 12,000,000 31,772,550 0 b. Circle the most appropriate cost driver for the Curatorial and Security activity cost pools. Then, complete the table below. Choose the best cost driver: A. Number of visitors B. Number of staff hours worked Number of special exhibits HKS Case Program Soft Case Number 20340 Curatorial Activities Security Activities Activity cost pool Activity cost driver quantity Activity cost driver rate 18.99 Calculate the total cost of Regular Exhibits and Special Exhibits. Regular Exhibits Special Exhibits Directly allocated costs Curatorial activities Security activities Total costs d. Jimenez knows that the total revenue indicated in below table) attributable to Regular Exhibits is C20,385,250 while the total revenue attributable to Special Exhibits is 10,394,250. Based on these figures and the total costs that he calculated in parts 2[c), what can Jimenez conclude about the financial performance of each program? Regular Exhibits Special Exhibits Revenue 20,385 250 10,394,250 Total Costs (from 2c) Surplus / Deficit Based on the variance analysis and the activity-based costing analysis, what do you recommend on how to improve the financial performance of the museum? HKS Case Program 6 of 6 Case Number 20340 Step by Step Solution
There are 3 Steps involved in it
Step: 1

Get Instant Access to Expert-Tailored Solutions
See step-by-step solutions with expert insights and AI powered tools for academic success
Step: 2

Step: 3
Ace Your Homework with AI
Get the answers you need in no time with our AI-driven, step-by-step assistance
Get Started
Do It Yourself Home Energy Audits 140 Simple Solutions To Lower Energy Costs, Increase Your Home's Efficiency, And Save The Environmen
Authors: David Findley
1st Edition
0071636390, 978-0071636391