Question: Do numbers: 1, 2, 3, 5, & 6 Answer the questions and explain how you got them. (if you cant answer all of them, answer
Do numbers: 1, 2, 3, 5, & 6
Answer the questions and explain how you got them. (if you cant answer all of them, answer what you can!)


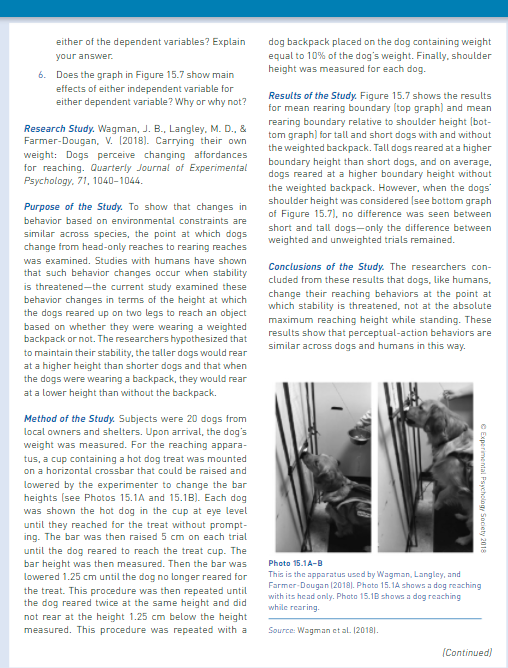
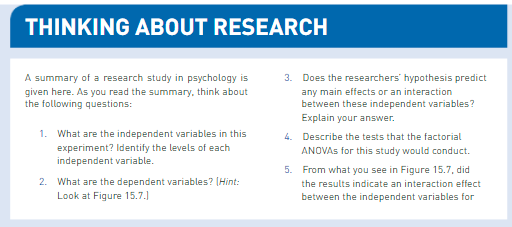
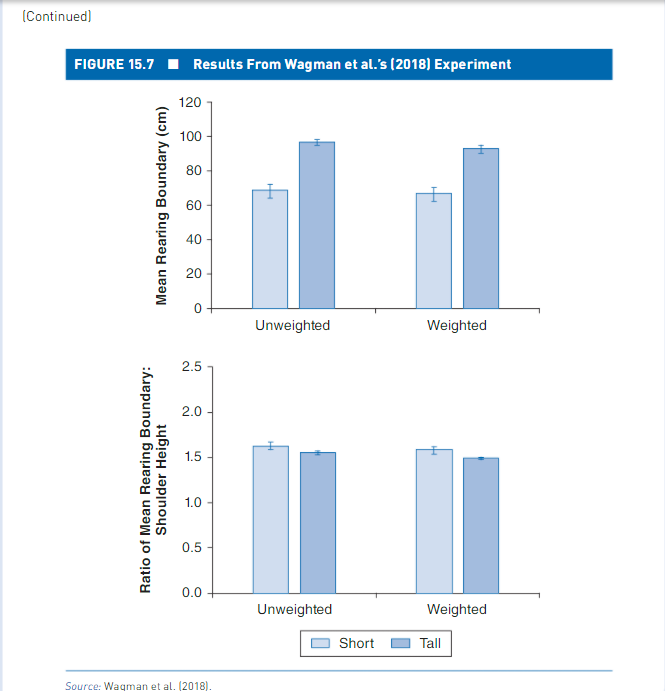
either of the dependent variables? Explain dog backpack placed on the dog containing weight your answer. equal to 10% of the dog's weight. Finally, shoulder 6. Does the graph in Figure 15.7 show main height was measured for each dog. effects of either independent variable for either dependent variable? Why or why not? Results of the Study. Figure 15.7 shows the results for mean rearing boundary (top graph) and mean Research Study. Wagman, J. B., Langley, M. D., & rearing boundary relative to shoulder height (bot- Farmer-Dougan, V. [2018). Carrying their own tom graph) for tall and short dogs with and without weight: Dogs perceive changing affordances the weighted backpack. Tall dogs reared at a higher for reaching. Quarterly Journal of Experimental boundary height than short dogs, and on average, Psychology, 71, 1040-1044. dogs reared at a higher boundary height without the weighted backpack. However, when the dogs Purpose of the Study. To show that changes in shoulder height was considered (see bottom graph behavior based on environmental constraints are of Figure 15.7), no difference was seen between similar across species, the point at which dogs short and tall dogs-only the difference between weighted and unweighted trials remained. change from head-only reaches to rearing reaches was examined. Studies with humans have shown that such behavior changes occur when stability Conclusions of the Study. The researchers con- cluded from these results that dogs, like humans, is threatened-the current study examined these behavior changes in terms of the height at which change their reaching behaviors at the point at the dogs reared up on two legs to reach an object which stability is threatened, not at the absolute based on whether they were wearing a weighted maximum reaching height while standing. These backpack or not. The researchers hypothesized that results show that perceptual-action behaviors are to maintain their stability, the taller dogs would rear similar across dogs and humans in this way. at a higher height than shorter dogs and that when the dogs were wearing a backpack, they would rear at a lower height than without the backpack. Method of the Study. Subjects were 20 dogs from local owners and shelters. Upon arrival, the dog's weight was measured. For the reaching appara- tus, a cup containing a hot dog treat was mounted on a horizontal crossbar that could be raised and lowered by the experimenter to change the bar @ Experimental Faychology Society 2018 heights (see Photos 15.1A and 15.18). Each dog was shown the hot dog in the cup at eye level until they reached for the treat without prompt- ing. The bar was then raised 5 cm on each trial until the dog reared to reach the treat cup. The bar height was then measured. Then the bar was Photo 15.1.A-B lowered 1.25 cm until the dog no longer reared for This is the apparatus used by Wagman, Langley, and the treat. This procedure was then repeated until Farmer-Dougan [2018). Photo 15.1A shows a dog reaching the dog reared twice at the same height and did with its head only. Photo 15.10 shows a dog reaching while rearing. not rear at the height 1.25 cm below the height measured. This procedure was repeated with a Source: Wagman et al. (20181. (Continued)THINKING ABOUT RESEARCH A summary of a research study in psychology is 3. Does the researchers' hypothesis predict given here. As you read the summary, think about any main effects or an interaction the following questions: between these independent variables? Explain your answer. 1. What are the independent variables in this 4. Describe the tests that the factorial experiment? Identify the levels of each ANOVAs for this study would conduct. independent variable. 5. From what you see in Figure 15.7, did 2. What are the dependent variables? (Hint: the results indicate an interaction effect Look at Figure 15.7.] between the independent variables for[Continued] FIGURE 15.7 . Results From Wagman et al.'s (2018) Experiment 120 100 80 Mean Rearing Boundary (cm) 60 40 20 0 Unweighted Weighted 2.5 2.0 1.5 Ratio of Mean Rearing Boundary: Shoulder Height 1.0 0.5 0.0 Unweighted Weighted Short Tall SOU (2018)
Step by Step Solution
There are 3 Steps involved in it

Get step-by-step solutions from verified subject matter experts


