

Question
Do Programming Exercise from Chapter 4, but add a decision to handle the case where the line does not intersect the circle. Chapter 4, Exercise
Do Programming Exercise from Chapter 4, but add a decision to handle the case where the line does not intersect the circle.
Chapter 4, Exercise 7:
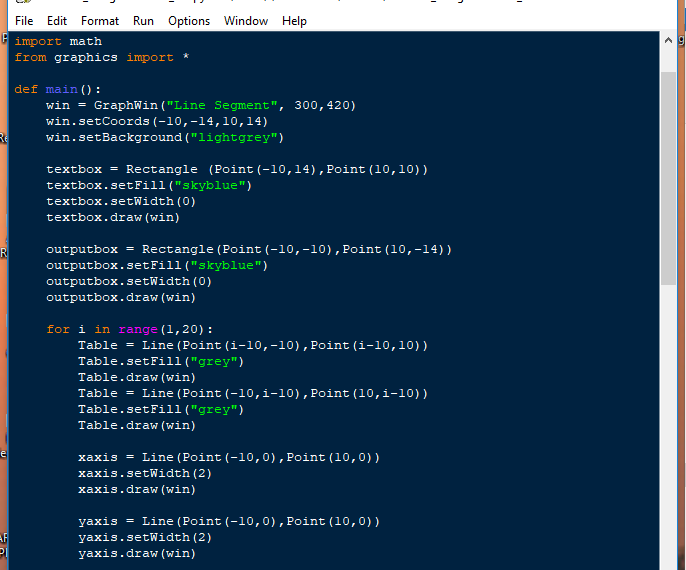
Write a program that computes the intersection of a circle with a horizontal line and displays the information textually and graphically.
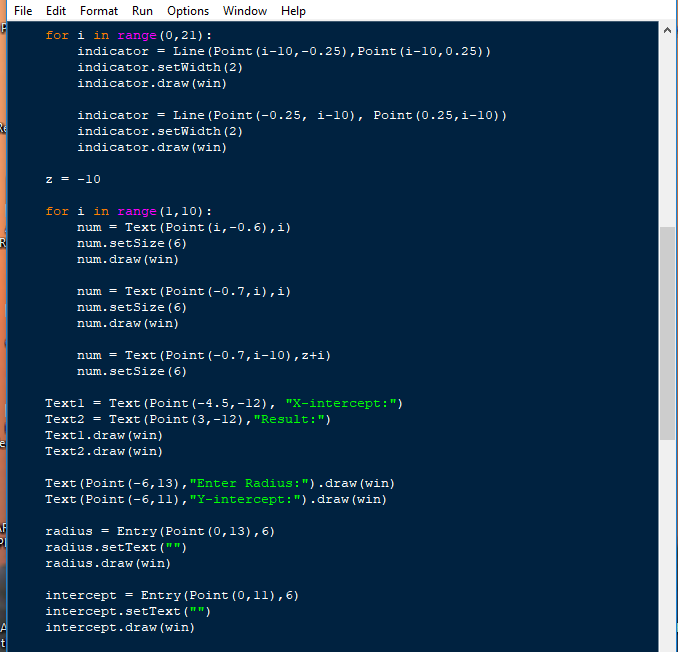
Input: Radius of the circle and the y-intercept of the line. Prompt the user for these values.
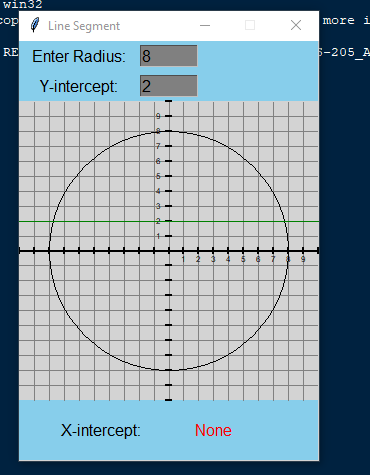
Output: Draw a circle centered at (0,0) with the given radius in a window with coordinates running from (10,10) to (10,10).
Draw a horizontal line across the window with the given y-intercept.
Draw the two points of intersection in red.
Print out the x values of the points of intersection in the upper left-hand corner of the window.
Formula for the intersection values of x:
+ and - square root of r squared - y squared
where r is the radius and y is the y-intercept.
When the user clicks anywhere on the window, it should close.
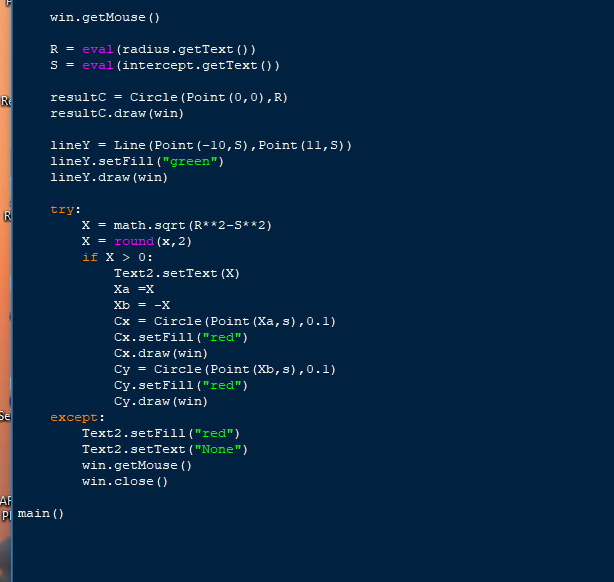
I think the problem is somewhere in the "try" statement. I can not get the red dots to show along with the X intercept message when the line does interesect the circle. It still says "None" under X-intercept. Please help.
Step by Step Solution
There are 3 Steps involved in it
Step: 1

Get Instant Access to Expert-Tailored Solutions
See step-by-step solutions with expert insights and AI powered tools for academic success
Step: 2

Step: 3
Ace Your Homework with AI
Get the answers you need in no time with our AI-driven, step-by-step assistance
Get Started
Oracle PL/SQL Programming Database Management Systems
Authors: Steven Feuerstein
1st Edition
978-1565921429