DO THE SAME STEPS WITH TURKISH LIRA INSTEAD OF AUS DOLLAR


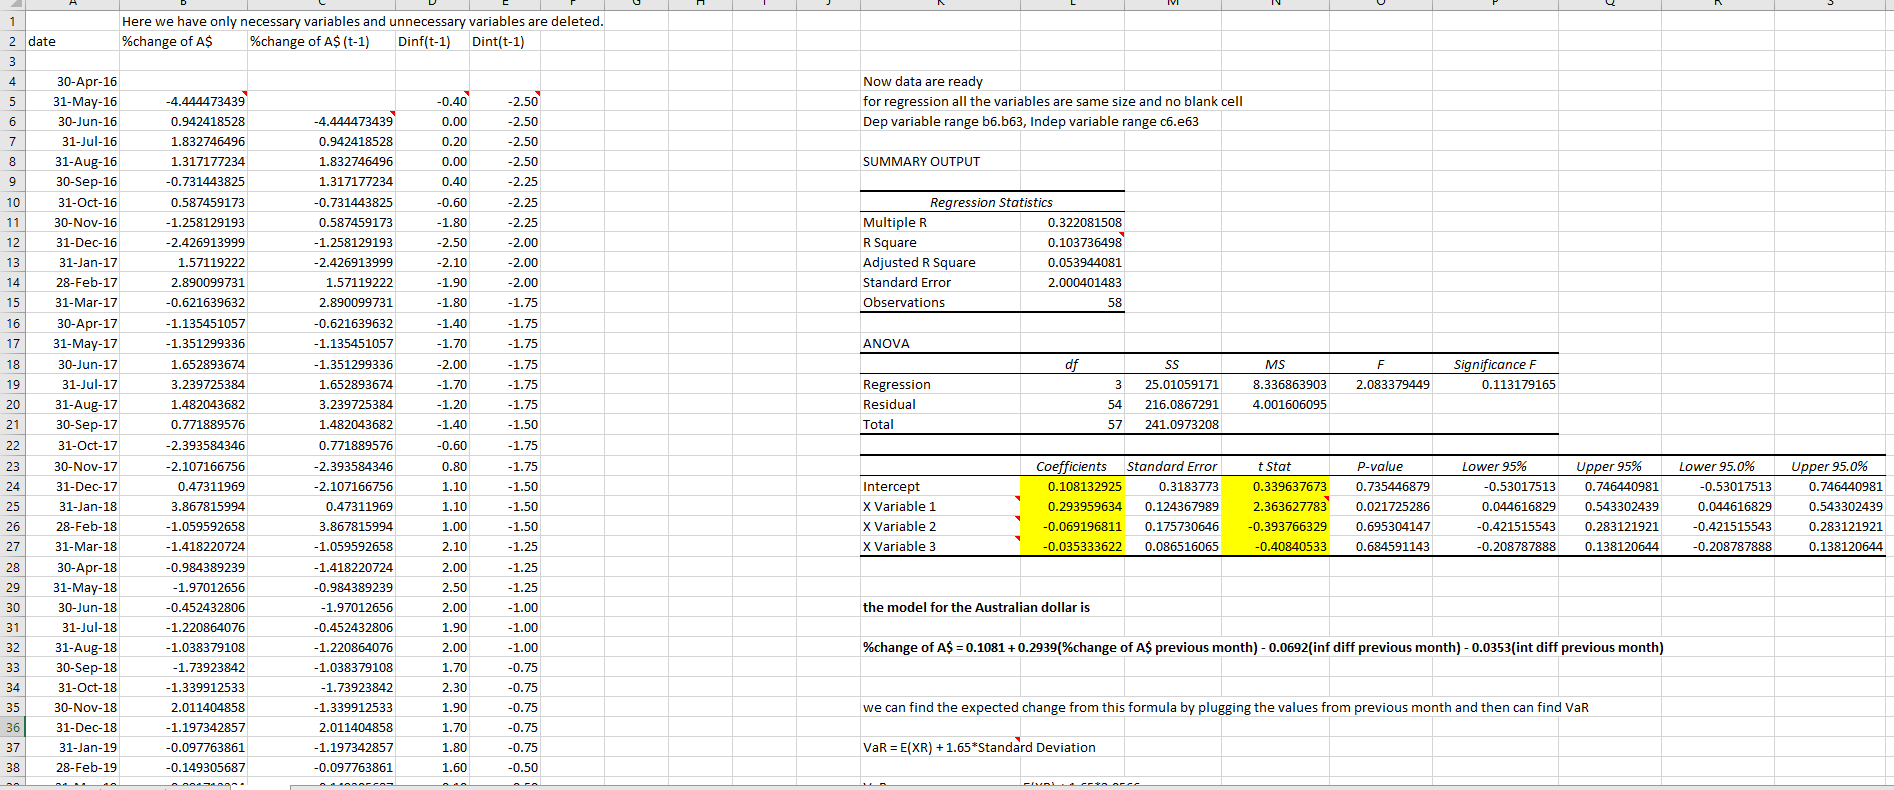
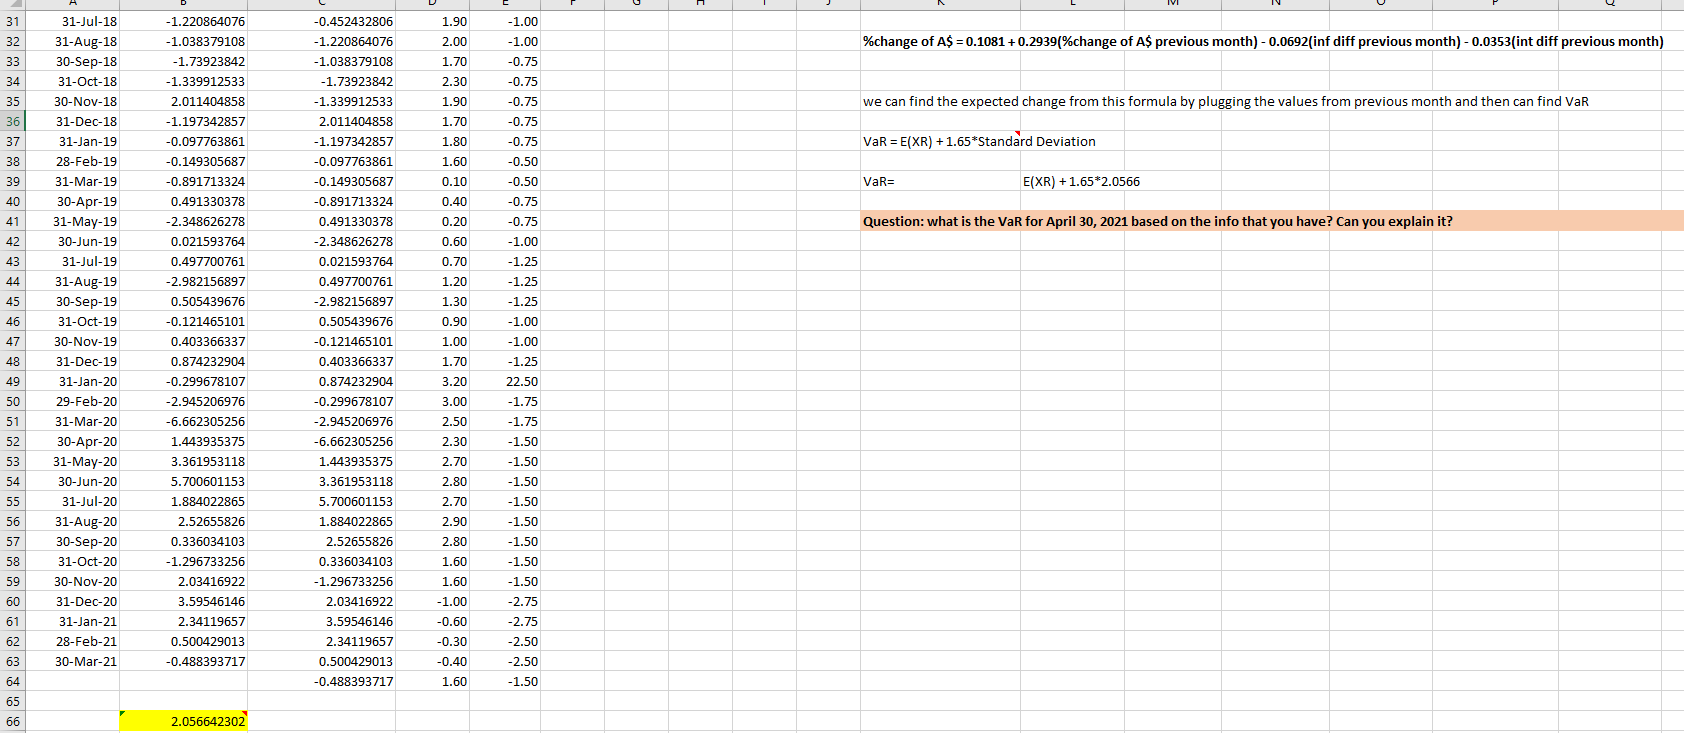
1 2 date Here we have only necessary variables and unnecessary variables are deleted. %change of A$ %change of A$(t-1) Dinf(t-1) Dint(t-1) 3 4 5 6 Now data are ready for regression all the variables are same size and no blank cell Dep variable range b6.b63, Indep variable range c6.e63 7 SUMMARY OUTPUT 8 9 10 11 -0.40 0.00 0.20 0.00 0.40 -0.60 -1.80 -2.50 -2.10 -1.90 -1.80 12 13 Regression Statistics Multiple R 0.322081508 R Square 0.103736498 Adjusted R Square 0.053944081 Standard Error 2.000401483 Observations 58 14 15 16 17 ANOVA 18 df F 2.083379449 Significance F 0.113179165 19 20 Regression Residual MS 8.336863903 4.001606095 3 54 57 30-Apr-16 31-May-16 30-Jun-16 31-Jul-16 31-Aug-16 30-Sep-16 31-Oct-16 30-Nov-16 31-Dec-16 31-Jan-17 28-Feb-17 31-Mar-17 30-Apr-17 31-May-17 30-Jun-17 31-Jul-17 31-Aug-17 30-Sep-17 31-Oct-17 30-Nov-17 31-Dec-17 31-Jan-18 28-Feb-18 31-Mar-18 30-Apr-18 31-May-18 30-Jun-18 31-Jul-18 31-Aug-18 30-Sep-18 31-Oct-18 30-Nov-18 31-Dec-18 31-Jan-19 28-Feb-19 SS 25.01059171 216.0867291 241.0973208 21 Total -4.444473439 0.942418528 1.832746496 1.317177234 -0.731443825 0.587459173 -1.258129193 -2.426913999 1.57119222 2.890099731 -0.621639632 -1.135451057 -1.351299336 1.652893674 3.239725384 1.482043682 0.771889576 -2.393584346 -2.107166756 0.47311969 3.867815994 -1.059592658 -1.418220724 -0.984389239 -1.97012656 -0.452432806 -1.220864076 -1.038379108 -1.73923842 -1.339912533 2.011404858 -1.197342857 -0.097763861 -0.149305687 -4.444473439 0.942418528 1.832746496 1.317177234 -0.731443825 0.587459173 -1.258129193 -2.426913999 1.57119222 2.890099731 -0.621639632 -1.135451057 -1.351299336 1.652893674 3.239725384 1.482043682 0.771889576 -2.393584346 -2.107166756 0.47311969 3.867815994 -1.059592658 -1.418220724 -0.984389239 -1.97012656 -0.452432806 -1.220864076 -1.038379108 -1.73923842 -1.339912533 2.011404858 -1.197342857 -0.097763861 22 -2.50 -2.50 -2.50 -2.50 -2.25 -2.25 -2.25 -2.00 -2.00 -2.00 -1.75 -1.75 -1.75 -1.75 -1.75 -1.75 -1.50 -1.75 -1.75 -1.50 -1.50 -1.50 -1.25 -1.25 -1.25 -1.00 -1.00 -1.00 -0.75 -0.75 -0.75 -0.75 -0.75 -0.50 23 Upper 95% 24 25 -1.40 -1.70 -2.00 -1.70 - 1.20 -1.40 -0.60 0.80 1.10 1.10 1.00 2.10 2.00 2.50 2.00 1.90 2.00 1.70 2.30 1.90 1.70 1.80 1.60 Intercept X Variable 1 X Variable 2 X Variable 3 Coefficients Standard Error 0.108132925 0.3183773 0.293959634 0.124367989 -0.069196811 0.175730646 -0.035333622 0.086516065 t Stat 0.339637673 2.363627783 -0.393766329 -0.40840533 P-value 0.735446879 0.021725286 0.695304147 0.684591143 Lower 95% -0.53017513 0.044616829 -0.421515543 -0.208787888 0.746440981 0.543302439 0.283121921 0.138120644 Lower 95.0% -0.53017513 0.044616829 -0.421515543 -0.208787888 Upper 95.0% 0.746440981 0.543302439 0.283121921 0.138120644 26 27 28 29 30 the model for the Australian dollar is 31 %change of A$ = 0.1081 +0.2939(%change of As previous month) - 0.0692(inf diff previous month) - 0.0353(int diff previous month) 32 33 34 35 we can find the expected change from this formula by plugging the values from previous month and then can find VaR 36 37 VaR = E(XR) +1.65*Standard Deviation 38 31 1.90 -1.00 -1.00 32 2.00 - 1.220864076 -1.038379108 -1.73923842 -1.339912533 %change of A$ = 0.1081 +0.2939(%change of A$ previous month) - 0.0692(inf diff previous month) - 0.0353(int diff previous month) 33 1.70 34 -0.75 -0.75 -0.75 2.30 1.90 1.70 1.80 35 36 we can find the expected change from this formula by plugging the values from previous month and then can find VaR -0.75 -0.75 -0.50 37 38 VaR = E(XR) +1.65*Standard Deviation 1.60 2.011404858 -1.197342857 -0.097763861 -0.149305687 -0.891713324 0.491330378 -2.348626278 0.021593764 39 0.10 VaR= E(XR) + 1.65*2.0566 40 0.40 41 0.20 -0.50 -0.75 -0.75 -1.00 -1.25 Question: what is the VaR for April 30, 2021 based on the info that you have? Can you explain it? 0.60 42 43 44 0.497700761 0.70 1.20 1.30 -2.982156897 0.505439676 -1.25 45 -1.25 46 0.90 31-Jul-18 31-Aug-18 30-Sep-18 31-Oct-18 30-Nov-18 31-Dec-18 31-Jan-19 28-Feb-19 31-Mar-19 30-Apr-19 31-May-19 30-Jun-19 31-Jul-19 31-Aug-19 30-Sep-19 31-Oct-19 30-Nov-19 31-Dec-19 31-Jan-20 29-Feb-20 31-Mar-20 30-Apr-20 31-May-20 30-Jun-20 31-Jul-20 31-Aug-20 30-Sep-20 31-Oct-20 30-Nov-20 31-Dec-20 31-Jan-21 28-Feb-21 30-Mar-21 -1.00 -1.00 47 1.00 -0.452432806 -1.220864076 -1.038379108 -1.73923842 -1.339912533 2.011404858 -1.197342857 -0.097763861 -0.149305687 -0.891713324 0.491330378 -2.348626278 0.021593764 0.497700761 -2.982156897 0.505439676 -0.121465101 0.403366337 0.874232904 -0.299678107 -2.945206976 -6.662305256 1.443935375 3.361953118 5.700601153 1.884022865 2.52655826 0.336034103 -1.296733256 2.03416922 3.59546146 2.34119657 0.500429013 -0.488393717 -1.25 48 49 50 1.70 3.20 22.50 3.00 -1.75 -1.75 -0.121465101 0.403366337 0.874232904 -0.299678107 -2.945206976 -6.662305256 1.443935375 3.361953118 5.700601153 1.884022865 2.52655826 0.336034103 -1.296733256 51 52 2.50 2.30 2.70 53 -1.50 -1.50 -1.50 -1.50 54 2.80 2.70 55 56 57 2.90 2.80 -1.50 -1.50 -1.50 58 1.60 59 -1.50 -2.75 60 1.60 -1.00 -0.60 2.03416922 3.59546146 2.34119657 0.500429013 -0.488393717 61 -2.75 -2.50 62 -0.30 -0.40 1.60 -2.50 -1.50 63 64 65 66 2.056642302 1 2 date Here we have only necessary variables and unnecessary variables are deleted. %change of A$ %change of A$(t-1) Dinf(t-1) Dint(t-1) 3 4 5 6 Now data are ready for regression all the variables are same size and no blank cell Dep variable range b6.b63, Indep variable range c6.e63 7 SUMMARY OUTPUT 8 9 10 11 -0.40 0.00 0.20 0.00 0.40 -0.60 -1.80 -2.50 -2.10 -1.90 -1.80 12 13 Regression Statistics Multiple R 0.322081508 R Square 0.103736498 Adjusted R Square 0.053944081 Standard Error 2.000401483 Observations 58 14 15 16 17 ANOVA 18 df F 2.083379449 Significance F 0.113179165 19 20 Regression Residual MS 8.336863903 4.001606095 3 54 57 30-Apr-16 31-May-16 30-Jun-16 31-Jul-16 31-Aug-16 30-Sep-16 31-Oct-16 30-Nov-16 31-Dec-16 31-Jan-17 28-Feb-17 31-Mar-17 30-Apr-17 31-May-17 30-Jun-17 31-Jul-17 31-Aug-17 30-Sep-17 31-Oct-17 30-Nov-17 31-Dec-17 31-Jan-18 28-Feb-18 31-Mar-18 30-Apr-18 31-May-18 30-Jun-18 31-Jul-18 31-Aug-18 30-Sep-18 31-Oct-18 30-Nov-18 31-Dec-18 31-Jan-19 28-Feb-19 SS 25.01059171 216.0867291 241.0973208 21 Total -4.444473439 0.942418528 1.832746496 1.317177234 -0.731443825 0.587459173 -1.258129193 -2.426913999 1.57119222 2.890099731 -0.621639632 -1.135451057 -1.351299336 1.652893674 3.239725384 1.482043682 0.771889576 -2.393584346 -2.107166756 0.47311969 3.867815994 -1.059592658 -1.418220724 -0.984389239 -1.97012656 -0.452432806 -1.220864076 -1.038379108 -1.73923842 -1.339912533 2.011404858 -1.197342857 -0.097763861 -0.149305687 -4.444473439 0.942418528 1.832746496 1.317177234 -0.731443825 0.587459173 -1.258129193 -2.426913999 1.57119222 2.890099731 -0.621639632 -1.135451057 -1.351299336 1.652893674 3.239725384 1.482043682 0.771889576 -2.393584346 -2.107166756 0.47311969 3.867815994 -1.059592658 -1.418220724 -0.984389239 -1.97012656 -0.452432806 -1.220864076 -1.038379108 -1.73923842 -1.339912533 2.011404858 -1.197342857 -0.097763861 22 -2.50 -2.50 -2.50 -2.50 -2.25 -2.25 -2.25 -2.00 -2.00 -2.00 -1.75 -1.75 -1.75 -1.75 -1.75 -1.75 -1.50 -1.75 -1.75 -1.50 -1.50 -1.50 -1.25 -1.25 -1.25 -1.00 -1.00 -1.00 -0.75 -0.75 -0.75 -0.75 -0.75 -0.50 23 Upper 95% 24 25 -1.40 -1.70 -2.00 -1.70 - 1.20 -1.40 -0.60 0.80 1.10 1.10 1.00 2.10 2.00 2.50 2.00 1.90 2.00 1.70 2.30 1.90 1.70 1.80 1.60 Intercept X Variable 1 X Variable 2 X Variable 3 Coefficients Standard Error 0.108132925 0.3183773 0.293959634 0.124367989 -0.069196811 0.175730646 -0.035333622 0.086516065 t Stat 0.339637673 2.363627783 -0.393766329 -0.40840533 P-value 0.735446879 0.021725286 0.695304147 0.684591143 Lower 95% -0.53017513 0.044616829 -0.421515543 -0.208787888 0.746440981 0.543302439 0.283121921 0.138120644 Lower 95.0% -0.53017513 0.044616829 -0.421515543 -0.208787888 Upper 95.0% 0.746440981 0.543302439 0.283121921 0.138120644 26 27 28 29 30 the model for the Australian dollar is 31 %change of A$ = 0.1081 +0.2939(%change of As previous month) - 0.0692(inf diff previous month) - 0.0353(int diff previous month) 32 33 34 35 we can find the expected change from this formula by plugging the values from previous month and then can find VaR 36 37 VaR = E(XR) +1.65*Standard Deviation 38 31 1.90 -1.00 -1.00 32 2.00 - 1.220864076 -1.038379108 -1.73923842 -1.339912533 %change of A$ = 0.1081 +0.2939(%change of A$ previous month) - 0.0692(inf diff previous month) - 0.0353(int diff previous month) 33 1.70 34 -0.75 -0.75 -0.75 2.30 1.90 1.70 1.80 35 36 we can find the expected change from this formula by plugging the values from previous month and then can find VaR -0.75 -0.75 -0.50 37 38 VaR = E(XR) +1.65*Standard Deviation 1.60 2.011404858 -1.197342857 -0.097763861 -0.149305687 -0.891713324 0.491330378 -2.348626278 0.021593764 39 0.10 VaR= E(XR) + 1.65*2.0566 40 0.40 41 0.20 -0.50 -0.75 -0.75 -1.00 -1.25 Question: what is the VaR for April 30, 2021 based on the info that you have? Can you explain it? 0.60 42 43 44 0.497700761 0.70 1.20 1.30 -2.982156897 0.505439676 -1.25 45 -1.25 46 0.90 31-Jul-18 31-Aug-18 30-Sep-18 31-Oct-18 30-Nov-18 31-Dec-18 31-Jan-19 28-Feb-19 31-Mar-19 30-Apr-19 31-May-19 30-Jun-19 31-Jul-19 31-Aug-19 30-Sep-19 31-Oct-19 30-Nov-19 31-Dec-19 31-Jan-20 29-Feb-20 31-Mar-20 30-Apr-20 31-May-20 30-Jun-20 31-Jul-20 31-Aug-20 30-Sep-20 31-Oct-20 30-Nov-20 31-Dec-20 31-Jan-21 28-Feb-21 30-Mar-21 -1.00 -1.00 47 1.00 -0.452432806 -1.220864076 -1.038379108 -1.73923842 -1.339912533 2.011404858 -1.197342857 -0.097763861 -0.149305687 -0.891713324 0.491330378 -2.348626278 0.021593764 0.497700761 -2.982156897 0.505439676 -0.121465101 0.403366337 0.874232904 -0.299678107 -2.945206976 -6.662305256 1.443935375 3.361953118 5.700601153 1.884022865 2.52655826 0.336034103 -1.296733256 2.03416922 3.59546146 2.34119657 0.500429013 -0.488393717 -1.25 48 49 50 1.70 3.20 22.50 3.00 -1.75 -1.75 -0.121465101 0.403366337 0.874232904 -0.299678107 -2.945206976 -6.662305256 1.443935375 3.361953118 5.700601153 1.884022865 2.52655826 0.336034103 -1.296733256 51 52 2.50 2.30 2.70 53 -1.50 -1.50 -1.50 -1.50 54 2.80 2.70 55 56 57 2.90 2.80 -1.50 -1.50 -1.50 58 1.60 59 -1.50 -2.75 60 1.60 -1.00 -0.60 2.03416922 3.59546146 2.34119657 0.500429013 -0.488393717 61 -2.75 -2.50 62 -0.30 -0.40 1.60 -2.50 -1.50 63 64 65 66 2.056642302


