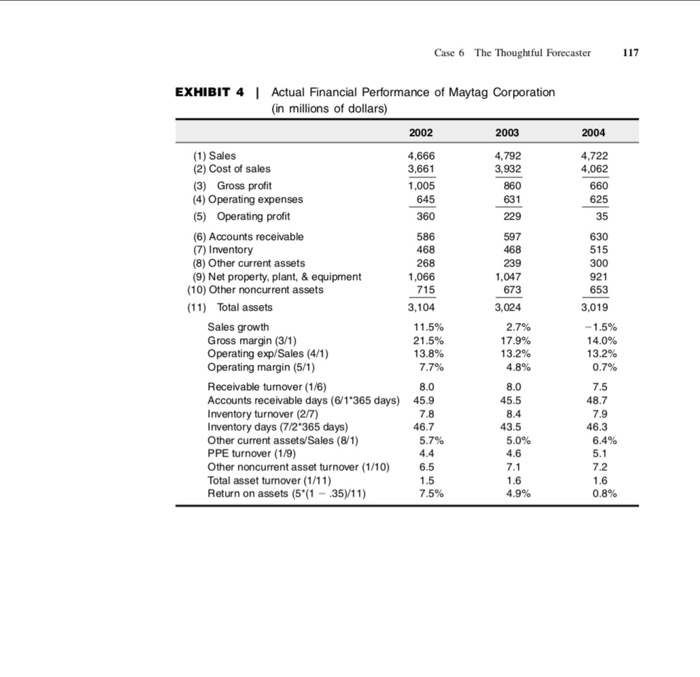
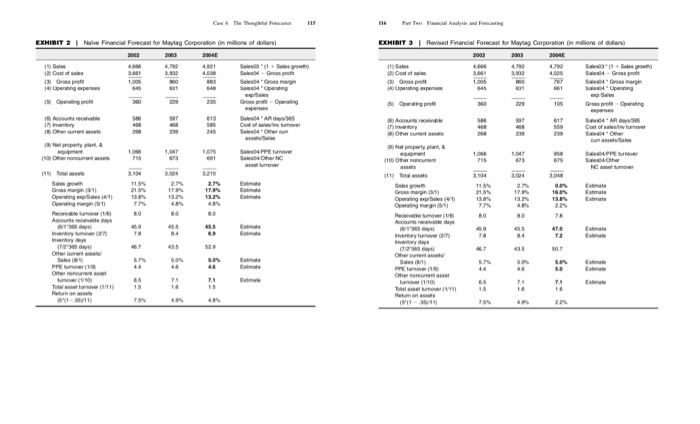
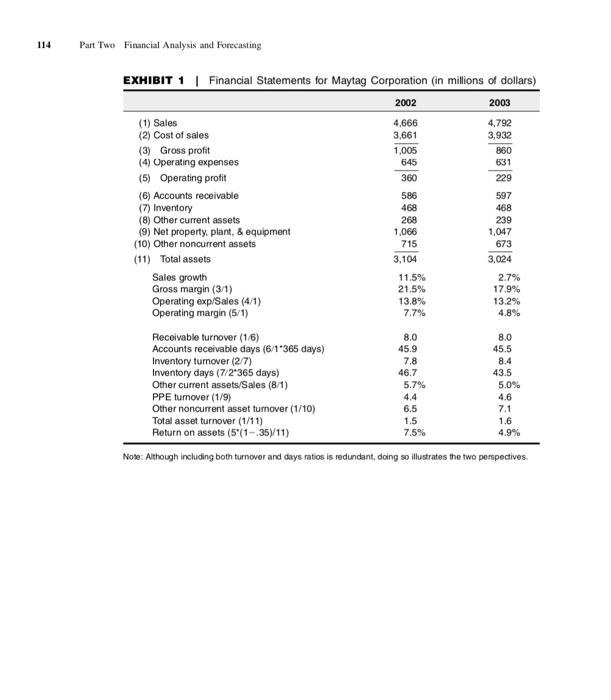
Do you agree with the various assumptions made in the forecasting of Maytag's financials? If not which ones do you not agree with?
Case 6 The Thoughtful Forecaster 117 EXHIBIT 4 | Actual Financial Performance of Maytag Corporation (in millions of dollars) 2002 2003 2004 4,792 3,932 860 4,722 4,062 660 625 35 4,666 3,661 1,005 645 360 586 468 268 1,066 715 3,104 (1) Sales (2) Cost of sales (3) Gross profit (4) Operating expenses (5) Operating profit (6) Accounts receivable (7) Inventory (8) Other current assets (9) Net property, plant, & equipment (10) Other noncurrent assets (11) Total assets Sales growth Gross margin (3/1) Operating exp/Sales (4/1) Operating margin (5/1) Receivable turnover (1/6) Accounts receivable days (6/1'365 days) Inventory turnover (2/7) Inventory days (7/2'365 days) Other current assets/Sales (8/1) PPE turnover (1/9) Other noncurrent asset turnover (1/10) Total asset turnover (1/11) Return on assets (5'(1 -.35/11) 239 1,047 673 3,024 2.7% 17.9% 13.2% 4.8% 630 515 300 921 653 3,019 -1.5% 14.0% 13.2% 0.7% 11.5% 21.5% 13.8% 7.7% 7.5 8.0 45.9 8.0 45.5 8.4 43.5 5.0% 4.6 48.7 7.9 46.3 6.4% 5.1 46.7 5.7% 4.4 6.5 1.5 7.5% 7.1 1.6 4.9% 7.2 1.6 0.8% Cw The Th 115 STA EXHIBIT 2 EXHIBIT 3 Revised Financial Forces or Maytag Corporation in ons of dollars) Naive Financial Forecast for Maytag Corporation on millions of dollars) 2002 2003 2004 S 1 + Sales Cost of sales S04Oro Operating pene Operating perces 19 Opewno property, plant Estimate 114 Part Two Financial Analysis and Forecasting EXHIBIT 1 | Financial Statements for Maytag Corporation (in millions of dollars) 2002 2003 4,666 3,661 1,005 645 360 586 468 (1) Sales (2) Cost of sales (3) Gross profit (4) Operating expenses (5) Operating profit (6) Accounts receivable (7) Inventory (8) Other current assets (9) Net property, plant, & equipment (10) Other noncurrent assets (11) Total assets Sales growth Gross margin (3/1) Operating exp/Sales (4/1) Operating margin (5/1) 4,792 3,932 860 631 229 597 468 239 1,047 673 3,024 268 1,066 715 3,104 11.5% 21.5% 13.8% 7.7% 2.7% 17.9% 13.2% 48% Receivable turnover (1/6) Accounts receivable days (6/1'365 days) Inventory turnover (277) Inventory days (7/2*365 days) Other current assets/Sales (8/1) PPE turnover (1/9) Other noncurrent asset turnover (1/10) Total asset turnover (1/11) Return on assets (5'(1-35/11) 8.0 45.9 7.8 46.7 5.7% 8.0 45.5 8.4 43.5 50% 4.6 4.4 6.5 1.5 1.6 7.5% 4.9% Note: Although including both turnover and days ratios is redundant, doing so illustrates the two perspectives. Case 6 The Thoughtful Forecaster 117 EXHIBIT 4 | Actual Financial Performance of Maytag Corporation (in millions of dollars) 2002 2003 2004 4,792 3,932 860 4,722 4,062 660 625 35 4,666 3,661 1,005 645 360 586 468 268 1,066 715 3,104 (1) Sales (2) Cost of sales (3) Gross profit (4) Operating expenses (5) Operating profit (6) Accounts receivable (7) Inventory (8) Other current assets (9) Net property, plant, & equipment (10) Other noncurrent assets (11) Total assets Sales growth Gross margin (3/1) Operating exp/Sales (4/1) Operating margin (5/1) Receivable turnover (1/6) Accounts receivable days (6/1'365 days) Inventory turnover (2/7) Inventory days (7/2'365 days) Other current assets/Sales (8/1) PPE turnover (1/9) Other noncurrent asset turnover (1/10) Total asset turnover (1/11) Return on assets (5'(1 -.35/11) 239 1,047 673 3,024 2.7% 17.9% 13.2% 4.8% 630 515 300 921 653 3,019 -1.5% 14.0% 13.2% 0.7% 11.5% 21.5% 13.8% 7.7% 7.5 8.0 45.9 8.0 45.5 8.4 43.5 5.0% 4.6 48.7 7.9 46.3 6.4% 5.1 46.7 5.7% 4.4 6.5 1.5 7.5% 7.1 1.6 4.9% 7.2 1.6 0.8% Cw The Th 115 STA EXHIBIT 2 EXHIBIT 3 Revised Financial Forces or Maytag Corporation in ons of dollars) Naive Financial Forecast for Maytag Corporation on millions of dollars) 2002 2003 2004 S 1 + Sales Cost of sales S04Oro Operating pene Operating perces 19 Opewno property, plant Estimate 114 Part Two Financial Analysis and Forecasting EXHIBIT 1 | Financial Statements for Maytag Corporation (in millions of dollars) 2002 2003 4,666 3,661 1,005 645 360 586 468 (1) Sales (2) Cost of sales (3) Gross profit (4) Operating expenses (5) Operating profit (6) Accounts receivable (7) Inventory (8) Other current assets (9) Net property, plant, & equipment (10) Other noncurrent assets (11) Total assets Sales growth Gross margin (3/1) Operating exp/Sales (4/1) Operating margin (5/1) 4,792 3,932 860 631 229 597 468 239 1,047 673 3,024 268 1,066 715 3,104 11.5% 21.5% 13.8% 7.7% 2.7% 17.9% 13.2% 48% Receivable turnover (1/6) Accounts receivable days (6/1'365 days) Inventory turnover (277) Inventory days (7/2*365 days) Other current assets/Sales (8/1) PPE turnover (1/9) Other noncurrent asset turnover (1/10) Total asset turnover (1/11) Return on assets (5'(1-35/11) 8.0 45.9 7.8 46.7 5.7% 8.0 45.5 8.4 43.5 50% 4.6 4.4 6.5 1.5 1.6 7.5% 4.9% Note: Although including both turnover and days ratios is redundant, doing so illustrates the two perspectives


