Answered step by step
Verified Expert Solution
Question
1 Approved Answer
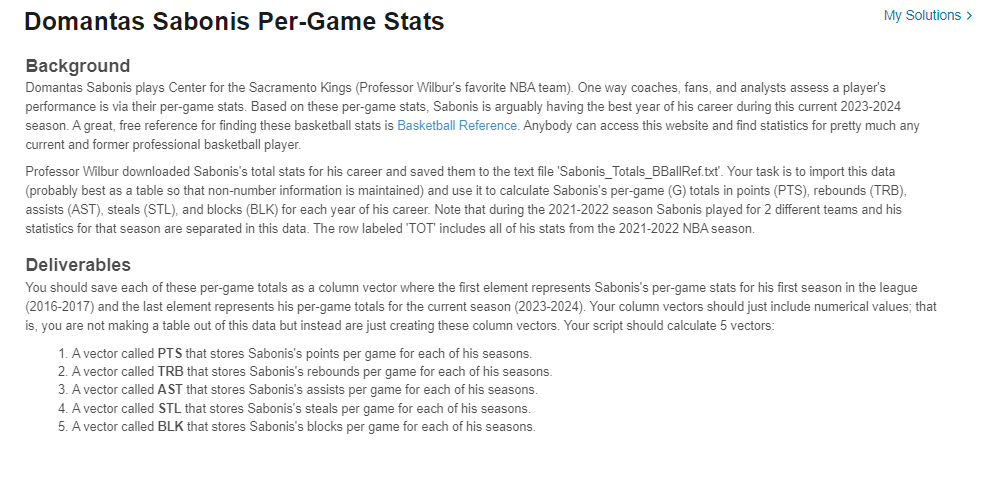
Domantas Sabonis Per - Game Stats Background Domantas Sabonis plays Center for the Sacramento Kings ( Professor Wilbur's favorite NBA team ) . One way
Domantas Sabonis PerGame Stats
Background
Domantas Sabonis plays Center for the Sacramento Kings Professor Wilbur's favorite NBA team One way coaches, fans, and analysts assess a player's
performance is via their pergame stats. Based on these pergame stats, Sabonis is arguably having the best year of his career during this current
season. A great, free reference for finding these basketball stats is Basketball Reference. Anybody can access this website and find statistics for pretty much any
current and former professional basketball player.
Professor Wilbur downloaded Sabonis's total stats for his career and saved them to the text file 'SabonisTotalsBBallRef.txt Your task is to import this data
probably best as a table so that nonnumber information is maintained and use it to calculate Sabonis's pergame G totals in points PTS rebounds TRB
assists AST steals STL and blocks BLK for each year of his career. Note that during the season Sabonis played for different teams and his
statistics for that season are separated in this data. The row labeled 'TOT' includes all of his stats from the NBA season.
Deliverables
You should save each of these pergame totals as a column vector where the first element represents Sabonis's pergame stats for his first season in the league
and the last element represents his pergame totals for the current season Your column vectors should just include numerical values; that
is you are not making a table out of this data but instead are just creating these column vectors. Your script should calculate vectors:
A vector called PTS that stores Sabonis's points per game for each of his seasons.
A vector called TRB that stores Sabonis's rebounds per game for each of his seasons.
A vector called AST that stores Sabonis's assists per game for each of his seasons.
A vector called STL that stores Sabonis's steals per game for each of his seasons.
A vector called BLK that stores Sabonis's blocks per game for each of his seasons.
It keeps give me the wrong results :( please it should be in matlab language and the data saved as document is wrong too, help!!

Step by Step Solution
There are 3 Steps involved in it
Step: 1

Get Instant Access to Expert-Tailored Solutions
See step-by-step solutions with expert insights and AI powered tools for academic success
Step: 2

Step: 3

Ace Your Homework with AI
Get the answers you need in no time with our AI-driven, step-by-step assistance
Get Started


