Download spreadsheet CaseSalesData-998acc.xlsx

pivot table
please help!
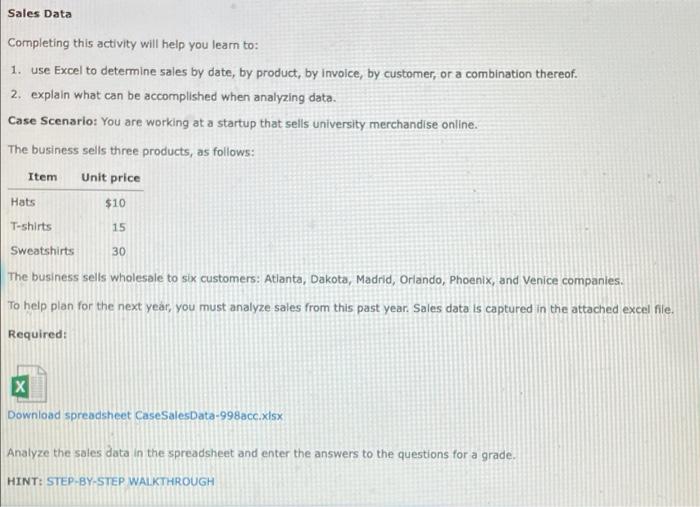
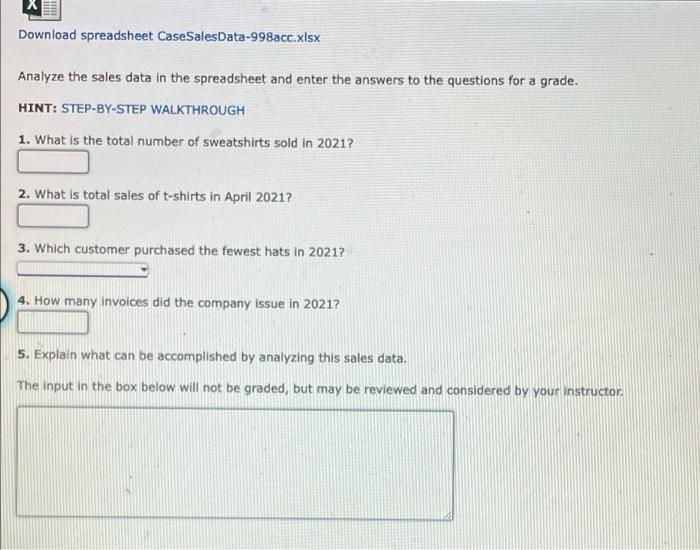
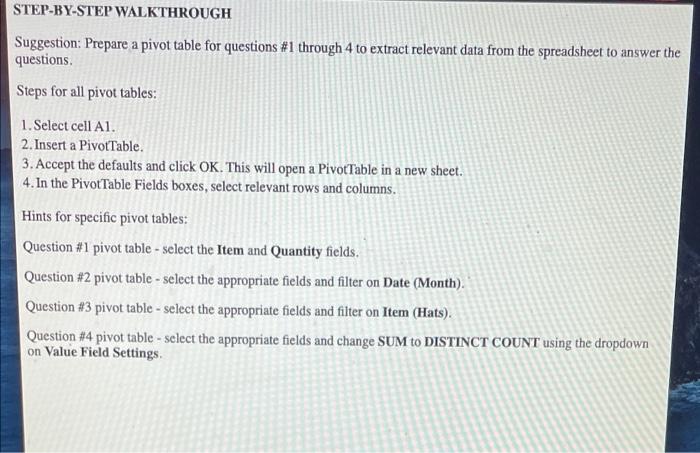
Sales Data Completing this activity will help you learn to: 1. use Excel to determine sales by date, by product, by involce, by customer, or a combination thereof. 2. explain what can be accomplished when analyzing data. Case Scenario: You are working at a startup that sells university merchandise online. The business sells three products, as follows: Item Unit price $10 T-shirts Sweatshirts The business sells wholesale to six customers: Atlanta, Dakota, Madrid, Orlando, Phoenix, and Venice companies. To help plan for the next year, you must analyze sales from this past year. Sales data is captured in the attached excel nie. Required: Hats 15 30 X Download spreadsheet CaseSalesData-998acc.xlsx Analyze the sales data in the spreadsheet and enter the answers to the questions for a grade. HINT: STEP-BY-STEP WALKTHROUGH Download spreadsheet CaseSales Data-998acc.xlsx Analyze the sales data in the spreadsheet and enter the answers to the questions for a grade. HINT: STEP-BY-STEP WALKTHROUGH 1. What is the total number of sweatshirts sold in 2021? 2. What is total sales of t-shirts in April 2021? 3. Which customer purchased the fewest hats in 2021? 4. How many invoices did the company issue in 2021? 5. Explain what can be accomplished by analyzing this sales data. The input in the box below will not be graded, but may be reviewed and considered by your instructor STEP-BY-STEP WALKTHROUGH Suggestion: Prepare a pivot table for questions #1 through 4 to extract relevant data from the spreadsheet to answer the questions Steps for all pivot tables: 1. Select cell Al. 2. Insert a Pivot Table. 3. Accept the defaults and click OK. This will open a PivotTable in a new sheet. 4. In the Pivot Table Fields boxes, select relevant rows and columns. Hints for specific pivot tables: Question #1 pivot table - select the Item and Quantity fields. Question #2 pivot table - select the appropriate fields and filter on Date (Month). Question #3 pivot table - select the appropriate fields and filter on Item (Hats). Question #4 pivot table - select the appropriate fields and change SUM to DISTINCT COUNT using the dropdown on Value Field Settings Sales Data Completing this activity will help you learn to: 1. use Excel to determine sales by date, by product, by involce, by customer, or a combination thereof. 2. explain what can be accomplished when analyzing data. Case Scenario: You are working at a startup that sells university merchandise online. The business sells three products, as follows: Item Unit price $10 T-shirts Sweatshirts The business sells wholesale to six customers: Atlanta, Dakota, Madrid, Orlando, Phoenix, and Venice companies. To help plan for the next year, you must analyze sales from this past year. Sales data is captured in the attached excel nie. Required: Hats 15 30 X Download spreadsheet CaseSalesData-998acc.xlsx Analyze the sales data in the spreadsheet and enter the answers to the questions for a grade. HINT: STEP-BY-STEP WALKTHROUGH Download spreadsheet CaseSales Data-998acc.xlsx Analyze the sales data in the spreadsheet and enter the answers to the questions for a grade. HINT: STEP-BY-STEP WALKTHROUGH 1. What is the total number of sweatshirts sold in 2021? 2. What is total sales of t-shirts in April 2021? 3. Which customer purchased the fewest hats in 2021? 4. How many invoices did the company issue in 2021? 5. Explain what can be accomplished by analyzing this sales data. The input in the box below will not be graded, but may be reviewed and considered by your instructor STEP-BY-STEP WALKTHROUGH Suggestion: Prepare a pivot table for questions #1 through 4 to extract relevant data from the spreadsheet to answer the questions Steps for all pivot tables: 1. Select cell Al. 2. Insert a Pivot Table. 3. Accept the defaults and click OK. This will open a PivotTable in a new sheet. 4. In the Pivot Table Fields boxes, select relevant rows and columns. Hints for specific pivot tables: Question #1 pivot table - select the Item and Quantity fields. Question #2 pivot table - select the appropriate fields and filter on Date (Month). Question #3 pivot table - select the appropriate fields and filter on Item (Hats). Question #4 pivot table - select the appropriate fields and change SUM to DISTINCT COUNT using the dropdown on Value Field Settings


