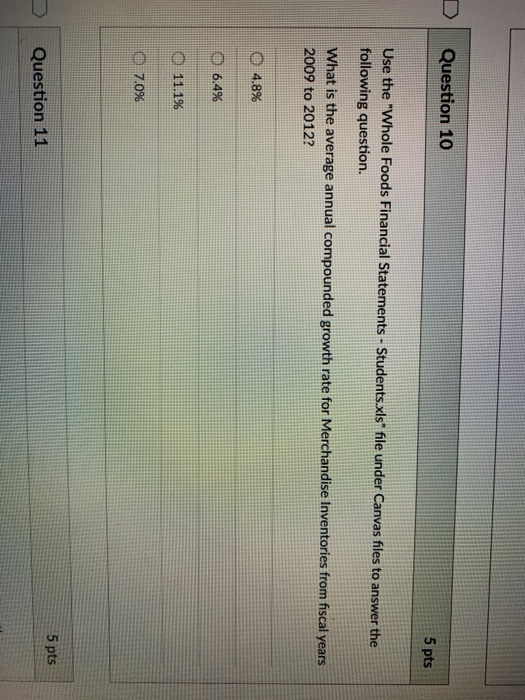
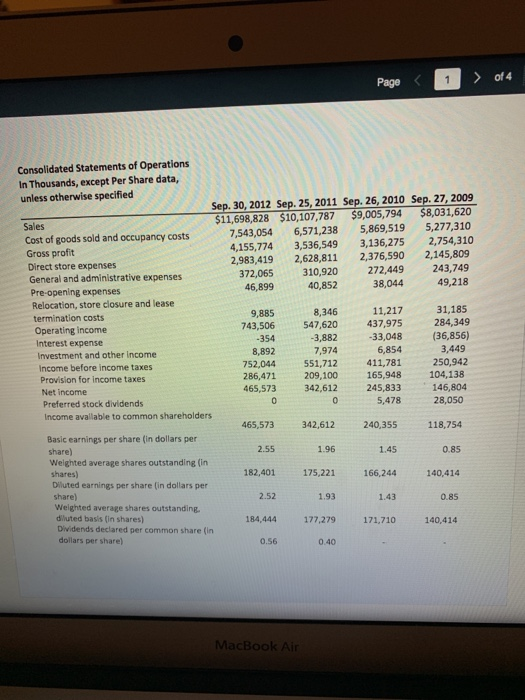
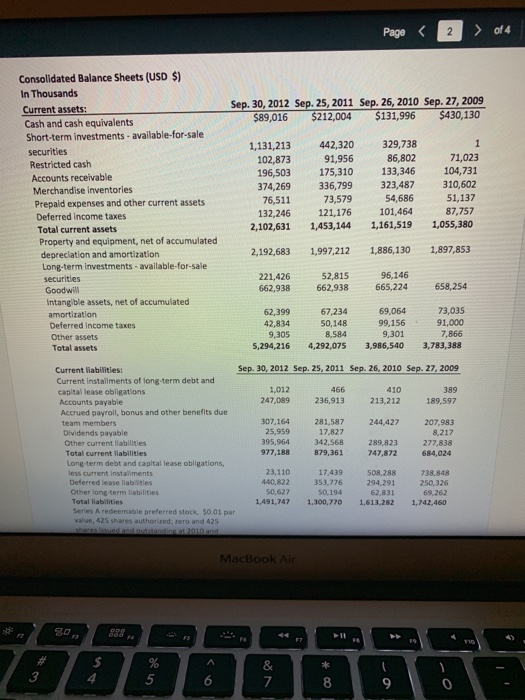
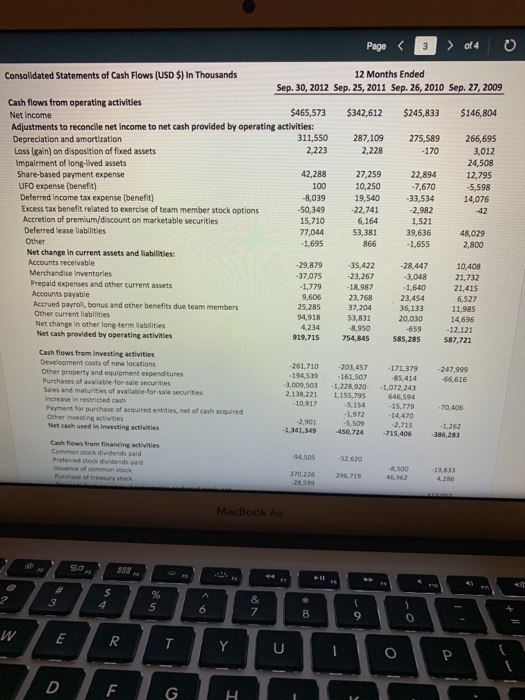
DQuestion 10 5 pts Use the "Whole Foods Financial Statements-Students xis fle under Canvas fles to answer the following question. at is the average annual compounded growth rate for Merchandise Inventories from fiscal years 2009 to 2012? :10 4.8% 6.4% 7.0% 5 pts Question 11 Page1of4 Consolidated Statements of Operations In Thousands, except Per Share data, Sep. 30, 2012 Sep. 25, 2011 Sep. 26, 2010 Sep. 27, 2009 $11,698,828 $10,107,787 $9,005,794 $8,031,620 unless otherwise specified Sales Cost of goods sold and occupancy costs Gross profit 7,543,054 6,571,238 5,869,519 5,277,310 4,155,774 3,536,549 3,136,275 2,754,310 2,983,419 2,628,811 2,376,590 2,145,809 372,065 310,920 272,449 243,749 Direct store expenses General and administrative expenses 38,044 11,217 3,882-33,048 (36,856) 49,218 31,185 284,349 3,449 46,899 40,852 g expenses Relocation, store closure and lease 8,346 9,885 743,506 -354 termination costs Operating income Interest expense Investment and other income Income before income taxes 547,620437,975 8.8923,882 7,974 6,854 752,044551,712 411,781 250,942 286,471 209,100 165,948 104,138 465,573 342,612 245,833146,804 Provision for income taxes Net income Preferred stock dividends Income avallable to common shareholders 5,478 28,050 465,573 342,612 240,355 118,754 Basic earnings per share (in dollars per share) Welghted average shares outstanding (in 2.55 1.96 1.45 0.85 182,401 175,221 166,244 140,414 Diluted earnings per share (in dollars per share) Weighted average shares outstanding dluted basis (in shares) Dividends declared per common share (in dollars per share) 1.93 177,279 0.40 2.52 1.43 0.85 184,444 171,710 140,414 0.56 Page Consolidated Balance Sheets (USD $) In Thousands Sep. 30, 2012 Sep. 25, 2011 Sep. 26, 2010 Sep. 27, 2009 Current assets Cash and cash equivalents Short-term investments - available-for-sale 589,016 $212,004 $131,996 $430,130 442,320 91,956 329,738 86,802 1,131,213 71,023 196,503 175,310 133,346 104,731 374,269 336,799 323,487 310,602 102,873 Restricted cash Accounts receivable Merchandise inventories Prepaid expenses and other current assets Deferred income taxes Total current assets 51,137 87,757 2,102,631 1,453,144 1,161,519 1,055,380 76,511 132,246 73,579 121,176 54,686 101,464 Property and equipment, net of accumulated depreclation and amortization Long-term investments- available-for-sale 2,192,683 1,997,212 1,886,130 1,897,853 221,426 662,938 52,815 662,938 96,146 665,224658,254 Intang ble assets, net of accumulated amortization Deferred income taxes Other assets Total assets 73,035 91,000 7,866 5,294,216 4,292,075 3,986,540 3,783,388 67,234 50,148 8,584 62,399 42,834 69,064 99,156 9,301 9,305 Sep. 30, 2012 Sep. 25,2011 Sep. 26, 2010 Sep. 27, 2009 Current liabilities: Current installments of long-term debt and capital lease obligations 466 389 247,089 236,913 213,212 189,597 Accounts payable Accrued payroll, bonus and other benefits due team members Dividends payable Other current liabilities 307,164 281,587 244,427 207,983 8,217 277,838 25,959 95,964 342,568 289,823 17,827 Total current liabilities 977,188 879,361 747,872 684,024 Long-term debt and capital lease obligations, less current instaliments Deferred lease liabities Other lone-term iabilities 738,848 250,326 69,262 1,491,747 1,300,770 1,613,282 1,742,460 23,110 440,822 50,627 17,439 353,776 508,288 294,291 62,831 Series A redeemable preferred stock, 50.01 par and 425 5 9 Page 3f4 Consolidated Statements of Cash Flows (USD $) In Thousands 12 Months Ended Cash flows from operating activities Net income Adjustments to reconcile net income to net cash provided by operating activities: Sep. 30, 2012 Sep. 25, 2011 Sep. 26, 2010 Sep. 27, 2009 $465,573 $342,612 $245,833 $146,804 11550 287,109 275,589 266,695 Loss (gain) on disposition of fixed assets -170 27,259 22,894 Deferred income tax expense (benefit) Excess tax benefit related to exercise of team member stock options Accretion of premium/discount on marketable securities Deferred lease llabilities 8,039 50,349 15,710 77,044 -22,741 6,164 53,381 33,534 2,982 1,521 39,636 Net change in current assets and liablities: 29,879 7,075 1,779 21,732 21,415 Prepald expenses and other current assets 18,987 23.768 37,204 23,454 36,133 Accrued payroll, bonus and other benefits due team members 94,918 Net change in other long-term labilities Net cash provided by operating activities 8,950 919,715 754,845 585,285 587,721 Cash flows from investing activities Development costs of new locations Other property and equipment expenditures 261,710 203,457 161,507 2,138,221 1.155,795 5,154 5,509 171,379 247,999 -66,616 194,539 3,009,503 1,228,920 1,072,243 646,594 Sales and maturities of available-for-sale securities 10,917 Payment for purchase of acquired entities, net of cash acquired Net cash used in investing activities Cash flows from financing activities 70,406 1.972 14,470 2,715 1.262 1,341,349 450,724 715,406 386,283 8,500 19,833 370.226 296,719 7 8
