Question
Draw a bar chart for the Region variable. Put appropriate labels for this graph. Make comments for this graph. Using python please code the

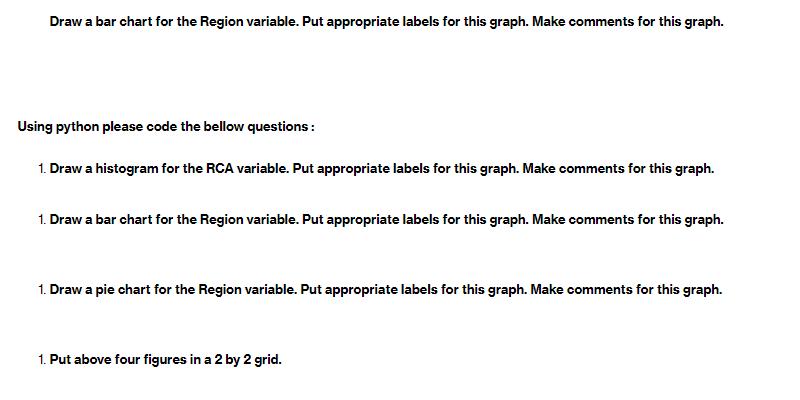
Draw a bar chart for the Region variable. Put appropriate labels for this graph. Make comments for this graph. Using python please code the bellow questions: 1. Draw a histogram for the RCA variable. Put appropriate labels for this graph. Make comments for this graph. 1. Draw a bar chart for the Region variable. Put appropriate labels for this graph. Make comments for this graph. 1. Draw a pie chart for the Region variable. Put appropriate labels for this graph. Make comments for this graph. 1. Put above four figures in a 2 by 2 grid.
Step by Step Solution
3.33 Rating (147 Votes )
There are 3 Steps involved in it
Step: 1

Get Instant Access to Expert-Tailored Solutions
See step-by-step solutions with expert insights and AI powered tools for academic success
Step: 2

Step: 3

Ace Your Homework with AI
Get the answers you need in no time with our AI-driven, step-by-step assistance
Get StartedRecommended Textbook for
Industrial Relations in Canada
Authors: Fiona McQuarrie
4th Edition
978-1-118-8783, 1118878396, 9781119050599 , 978-1118878392
Students also viewed these Programming questions
Question
Answered: 1 week ago
Question
Answered: 1 week ago
Question
Answered: 1 week ago
Question
Answered: 1 week ago
Question
Answered: 1 week ago
Question
Answered: 1 week ago
Question
Answered: 1 week ago
Question
Answered: 1 week ago
Question
Answered: 1 week ago
Question
Answered: 1 week ago
Question
Answered: 1 week ago
Question
Answered: 1 week ago
Question
Answered: 1 week ago
Question
Answered: 1 week ago
Question
Answered: 1 week ago
Question
Answered: 1 week ago
Question
Answered: 1 week ago
Question
Answered: 1 week ago
Question
Answered: 1 week ago
Question
Answered: 1 week ago
Question
Answered: 1 week ago
Question
Answered: 1 week ago
View Answer in SolutionInn App


