Answered step by step
Verified Expert Solution
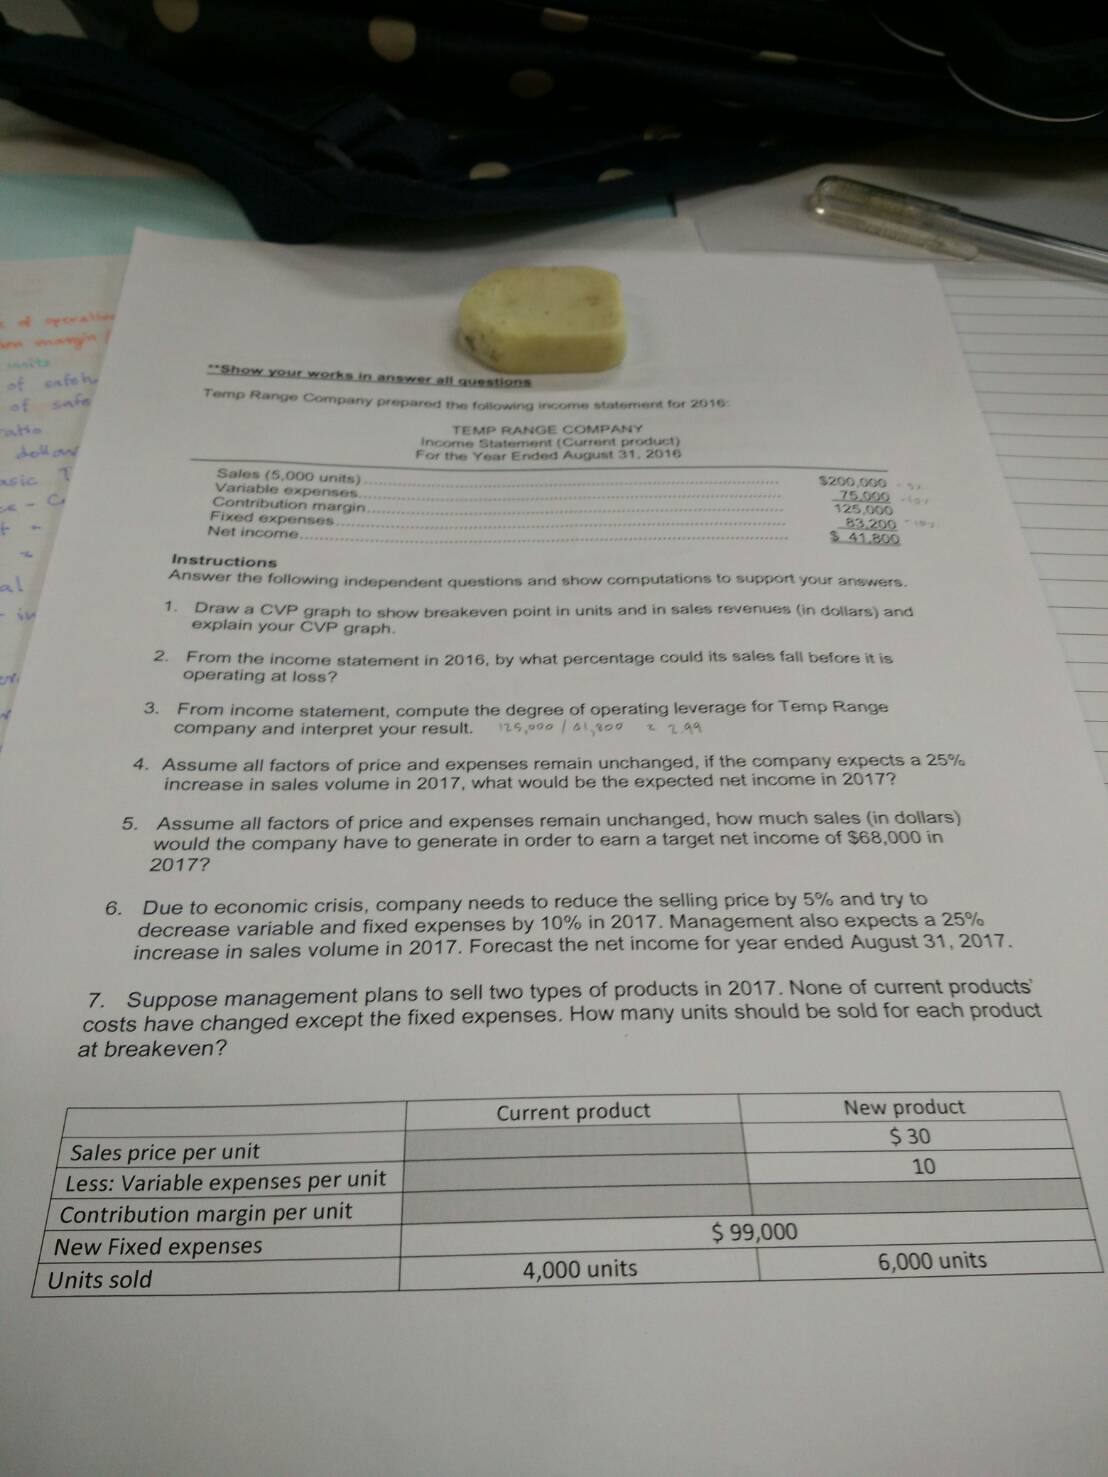
Question
1 Approved Answer
Draw a CVP graph to show breakeven point In units and in sales revenues (in dollars) and explain your CVP graph. From the Income statement
Draw a CVP graph to show breakeven point In units and in sales revenues (in dollars) and explain your CVP graph. From the Income statement in 2016, by what percentage could its sales fall before operating at loss? From income statement, compute the degree of operating leverage for Temp Range company and interpret your result. 125,000/01.800 = 2.99 Assume all factors of price and expenses remain unchanged, if the company expects a 25% increase in sales volume in 2017, what would be the expected net income in 2017? Assume all factors of price and expenses remain unchanged, how much sales (in dollars) would the company have to generate in order to earn a target net income of $68 000 in 2017? Due to economic crisis, company needs to reduce the setting price by 5% and try to decrease variable and fixed expenses by 10% in 2017. Management also expects a 25% increase in sales volume in 2017. Forecast the net income for year ended August 31, 2017. Suppose management plans to sell two types of products in 2017. None of current, products costs have changed except the fixed expenses. How many units should be sold for each product at breakeven
Step by Step Solution
There are 3 Steps involved in it
Step: 1
Get Instant Access to Expert-Tailored Solutions
See step-by-step solutions with expert insights and AI powered tools for academic success
Step: 2
Step: 3
Ace Your Homework with AI
Get the answers you need in no time with our AI-driven, step-by-step assistance
Get Started