

Question: Draw a Gantt Chart for the following processes by using the Round Robin algorithm with quantum of 20 ms. Then, calculate process waiting times and
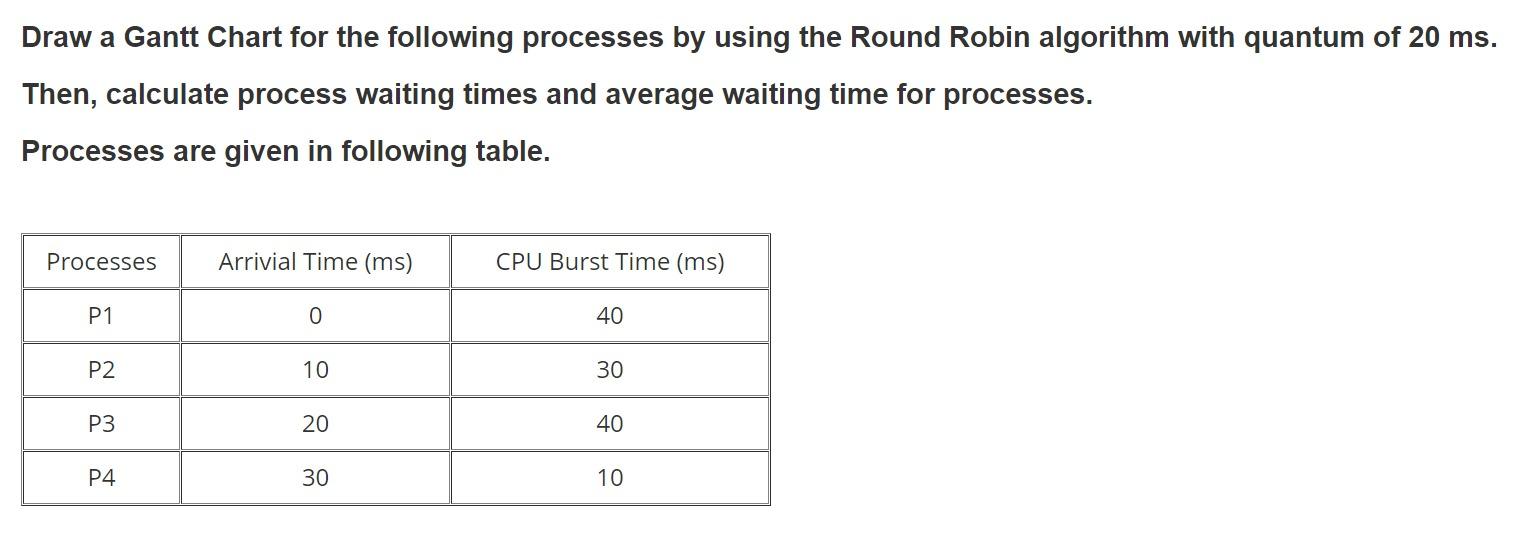
Draw a Gantt Chart for the following processes by using the Round Robin algorithm with quantum of 20 ms. Then, calculate process waiting times and average waiting time for processes. Processes are given in following table. Processes Arrivial Time (ms) CPU Burst Time (ms) P1 0 40 P2 10 30 P3 20 40 P4 30 10
Step by Step Solution
There are 3 Steps involved in it
1 Expert Approved Answer
Step: 1 Unlock

Question Has Been Solved by an Expert!
Get step-by-step solutions from verified subject matter experts
Step: 2 Unlock
Step: 3 Unlock