Answered step by step
Verified Expert Solution
Question
1 Approved Answer
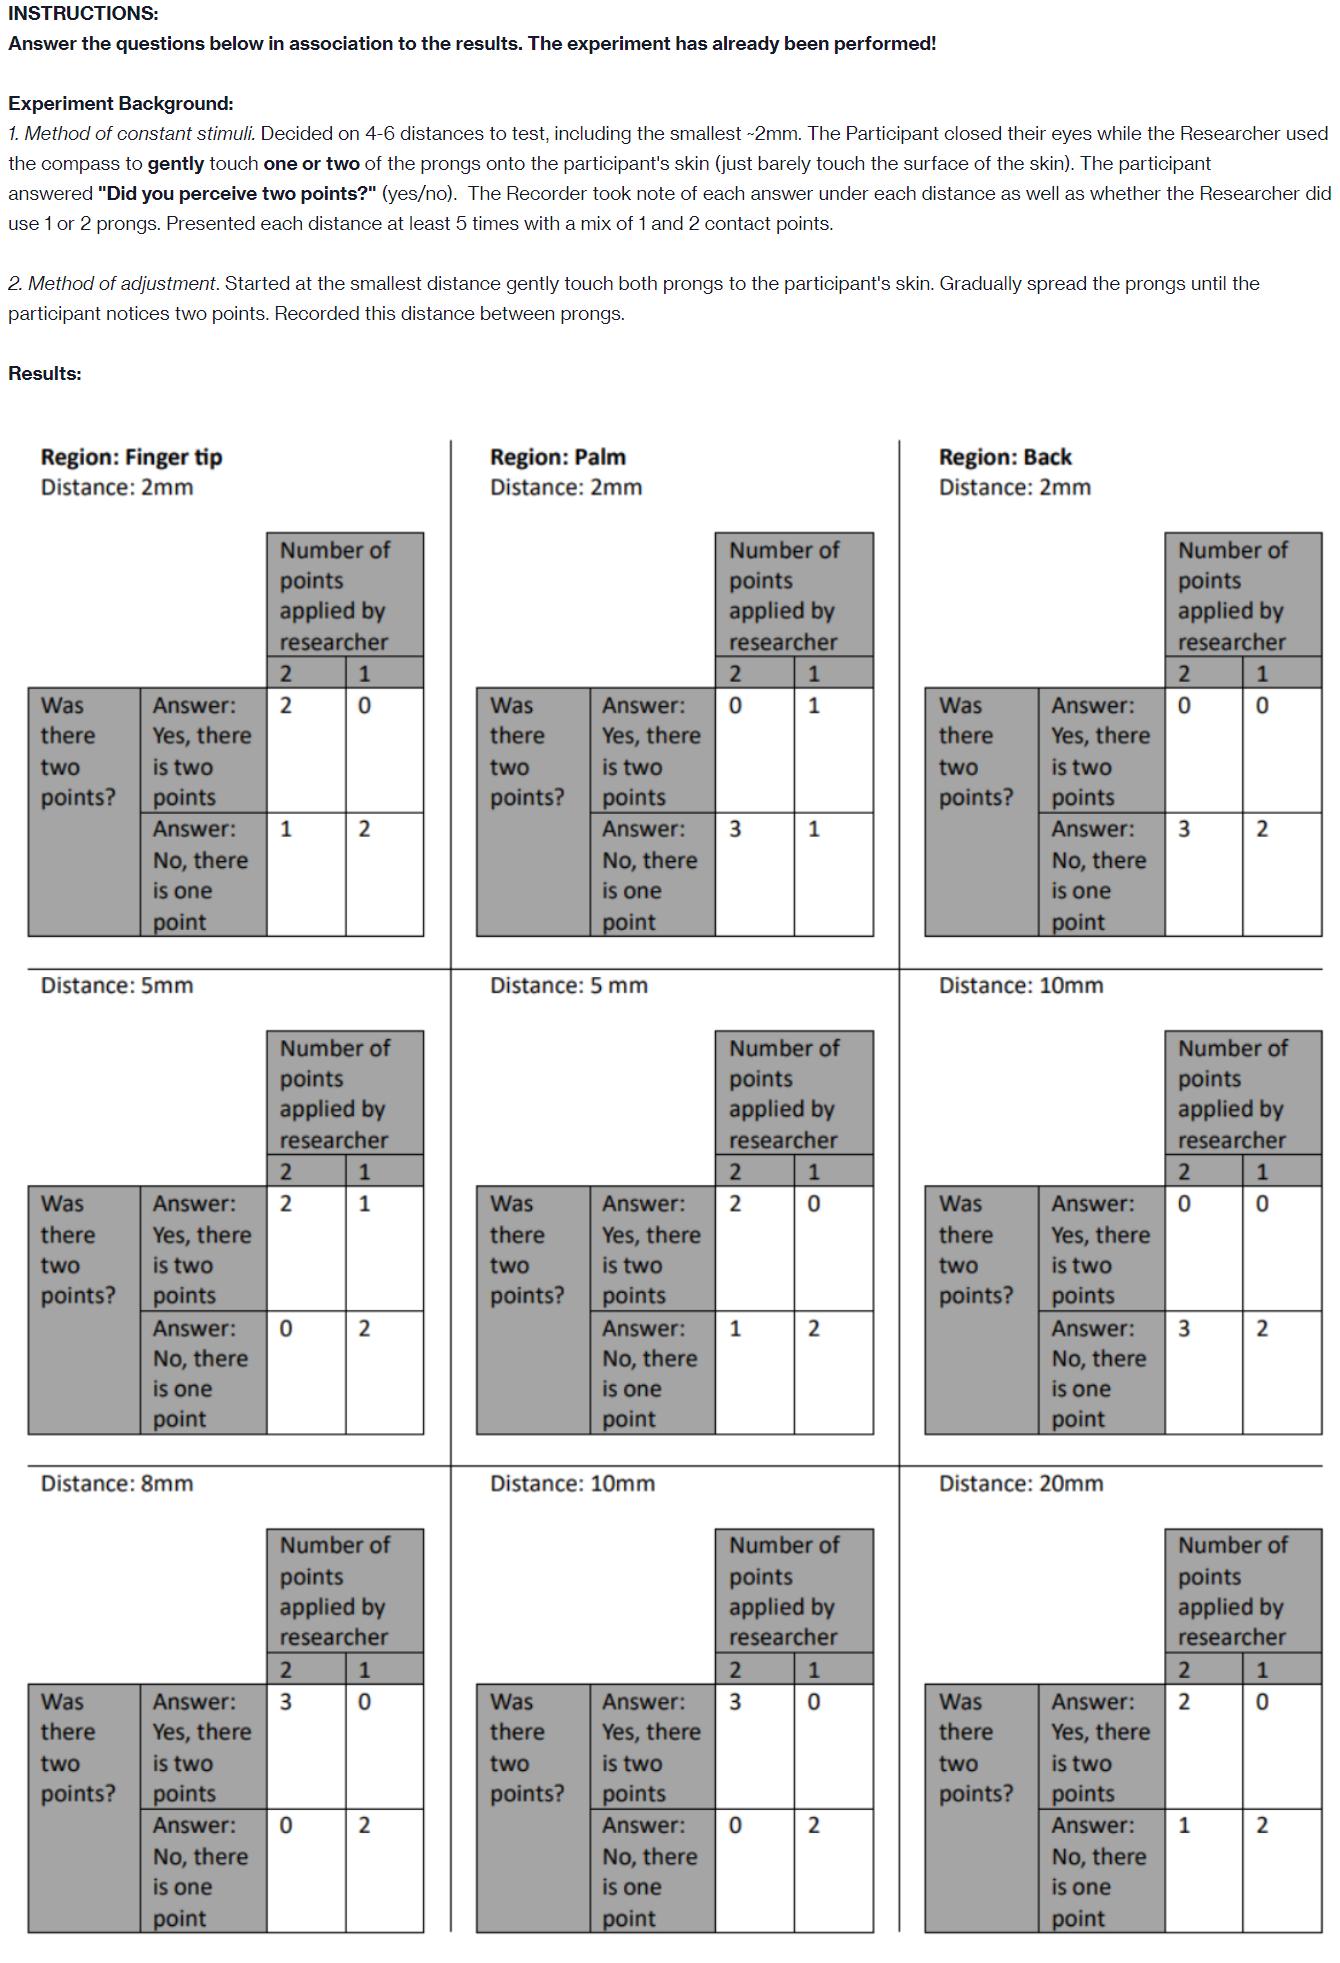
Draw a graph that plots the Hit Rate for each distance of the method of constant stimuli for your group's region. 4. Draw a

Draw a graph that plots the Hit Rate for each distance of the method of constant stimuli for your group's region.
4. Draw a receiver operating characteristic (ROC) graph of the proportion of hits versus false alarms with axis labels and chance performance indicated. Label each point with the distance tested. Include data for each region on the graph. Include a legend.
INSTRUCTIONS: Answer the questions below in association to the results. The experiment has already been performed! Experiment Background: 1. Method of constant stimuli. Decided on 4-6 distances to test, including the smallest ~2mm. The Participant closed their eyes while the Researcher used the compass to gently touch one or two of the prongs onto the participant's skin (just barely touch the surface of the skin). The participant answered "Did you perceive two points?" (yes/no). The Recorder took note of each answer under each distance as well as whether the Researcher did use 1 or 2 prongs. Presented each distance at least 5 times with a mix of 1 and 2 contact points. 2. Method of adjustment. Started at the smallest distance gently touch both prongs to the participant's skin. Gradually spread the prongs until the participant notices two points. Recorded this distance between prongs. Results: Region: Finger tip Distance: 2mm Was there two points? Was there two points? 2 Answer: 2 Yes, there is two points Answer: Distance: 5mm Was there two points? No, there is one point No, there is one point Distance: 8mm Number of points applied by researcher 1 Answer: Yes, there is two points Answer: 0 No, there is one point 2 2 Number of points applied by researcher 1 0 2 3 Answer: Yes, there is two points Answer: 0 2 1 1 Number of points applied by researcher 2 1 0 2 Region: Palm Distance: 2mm Was there two points? Was there two points? Answer: Yes, there is two points Answer: Distance: 5 mm No, there is one point Was there two points? No, there is one point Distance: 10mm Number of points applied by researcher 2 0 No, there is one point 3 Answer: Yes, there is two points Answer: 1 2 Number of points applied by researcher 1 20 1 1 2 3 Answer: Yes, there is two points Answer: 0 1 Number of points applied by researcher 2 1 0 2 Region: Back Distance: 2mm Was there two points? Was there two points? Distance: 10mm No, there is one point Was there two points? Answer: Yes, there is two points Answer: 3 Answer: Yes, there is two points Answer: No, there is one point Distance: 20mm Number of points applied by researcher 2 0 2 0 Number of points applied by researcher 3 1 0 2 2 2 Answer: Yes, there is two points Answer: 1 No, there is one point 1 0 Number of points applied by researcher 2 1 0 2
Step by Step Solution
★★★★★
3.49 Rating (156 Votes )
There are 3 Steps involved in it
Step: 1

Get Instant Access to Expert-Tailored Solutions
See step-by-step solutions with expert insights and AI powered tools for academic success
Step: 2

Step: 3

Ace Your Homework with AI
Get the answers you need in no time with our AI-driven, step-by-step assistance
Get Started


