Answered step by step
Verified Expert Solution
Question
1 Approved Answer
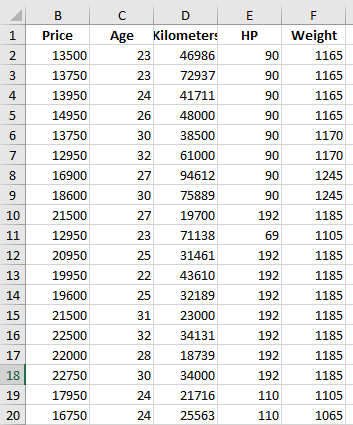
Draw a scatterplot in Excel and fit a regression line for price as a function of kilometers. Under the Line of Fit options, select the

Draw a scatterplot in Excel and fit a regression line for price as a function of kilometers. Under the Line of Fit options, select the equation check box to display the regression equation.
a. What is the regression equation?
b. For every one unit increase in kilometer, price increases by how many units?
B E F HP 1 2 Price 13500 Weight 1165 90 3 D Age Kilometers 23 46986 23 72937 24 41711 26 48000 30 38500 13750 13950 1165 90 90 4 1165 5 1165 14950 13750 90 90 6 7 12950 32 61000 90 1170 1170 1245 8 94612 90 9 27 30 27 90 1245 75889 19700 1185 16900 18600 21500 12950 20950 19950 19600 192 69 23 10 11 12 13 71138 25 192 1105 1185 1185 22 31461 43610 32189 23000 192 192 14 25 1185 1185 15 31 21500 22500 22000 192 192 16 32 34131 1185 17 28 192 1185 18739 34000 22750 192 1185 18 19 30 24 17950 21716 110 1105 20 16750 24 25563 110 1065 B E F HP 1 2 Price 13500 Weight 1165 90 3 D Age Kilometers 23 46986 23 72937 24 41711 26 48000 30 38500 13750 13950 1165 90 90 4 1165 5 1165 14950 13750 90 90 6 7 12950 32 61000 90 1170 1170 1245 8 94612 90 9 27 30 27 90 1245 75889 19700 1185 16900 18600 21500 12950 20950 19950 19600 192 69 23 10 11 12 13 71138 25 192 1105 1185 1185 22 31461 43610 32189 23000 192 192 14 25 1185 1185 15 31 21500 22500 22000 192 192 16 32 34131 1185 17 28 192 1185 18739 34000 22750 192 1185 18 19 30 24 17950 21716 110 1105 20 16750 24 25563 110 1065Step by Step Solution
There are 3 Steps involved in it
Step: 1

Get Instant Access to Expert-Tailored Solutions
See step-by-step solutions with expert insights and AI powered tools for academic success
Step: 2

Step: 3

Ace Your Homework with AI
Get the answers you need in no time with our AI-driven, step-by-step assistance
Get Started


