Answered step by step
Verified Expert Solution
Question
1 Approved Answer
Draw the mass balance in a X-T diagram for the data given in the table below! Physical properties CAO Temperature T[K] Conversion X [-] 300
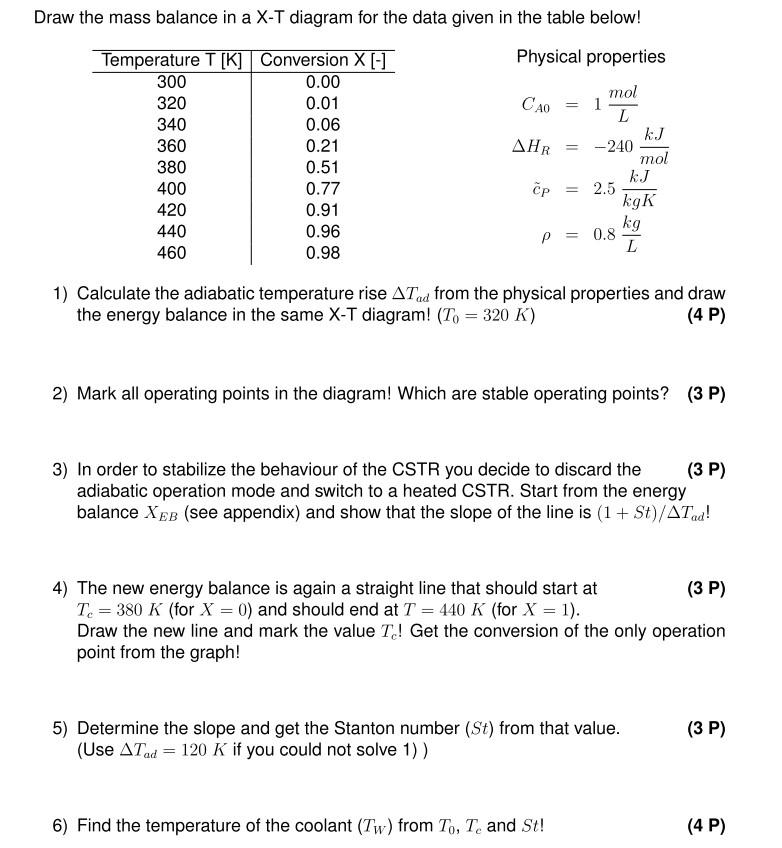
Draw the mass balance in a X-T diagram for the data given in the table below! Physical properties CAO Temperature T[K] Conversion X [-] 300 0.00 320 0.01 340 0.06 360 0.21 380 0.51 400 0.77 420 0.91 440 0.96 460 0.98 AHR mol 1 L -240 mol 2.5 kgK kg L cp = P = 0.8 1) Calculate the adiabatic temperature rise ATad from the physical properties and draw the energy balance in the same X-T diagram! (To = 320 K) (4 P) 2) Mark all operating points in the diagram! Which are stable operating points? (3P) 3) In order to stabilize the behaviour of the CSTR you decide to discard the (3P) adiabatic operation mode and switch to a heated CSTR. Start from the energy balance Xeb (see appendix) and show that the slope of the line is (1 + St)/AT! 4) The new energy balance is again a straight line that should start at (3P) T. = 380 K (for X = 0) and should end at T = 440 K (for X = 1). Draw the new line and mark the value T! Get the conversion of the only operation point from the graph! (3 P) 5) Determine the slope and get the Stanton number (St) from that value. (Use Arad = 120 K if you could not solve 1)) 6) Find the temperature of the coolant (Tw) from To, T. and St! (4 P)
Step by Step Solution
There are 3 Steps involved in it
Step: 1
Get Instant Access to Expert-Tailored Solutions
See step-by-step solutions with expert insights and AI powered tools for academic success
Step: 2
Step: 3
Ace Your Homework with AI
Get the answers you need in no time with our AI-driven, step-by-step assistance
Get Started