DuPont Analysis. Break down each companys Return on Equity, ROE, into the 3 part DuPont Equation for each year. Comment on what factors caused changes in your companys ROE over the time period.
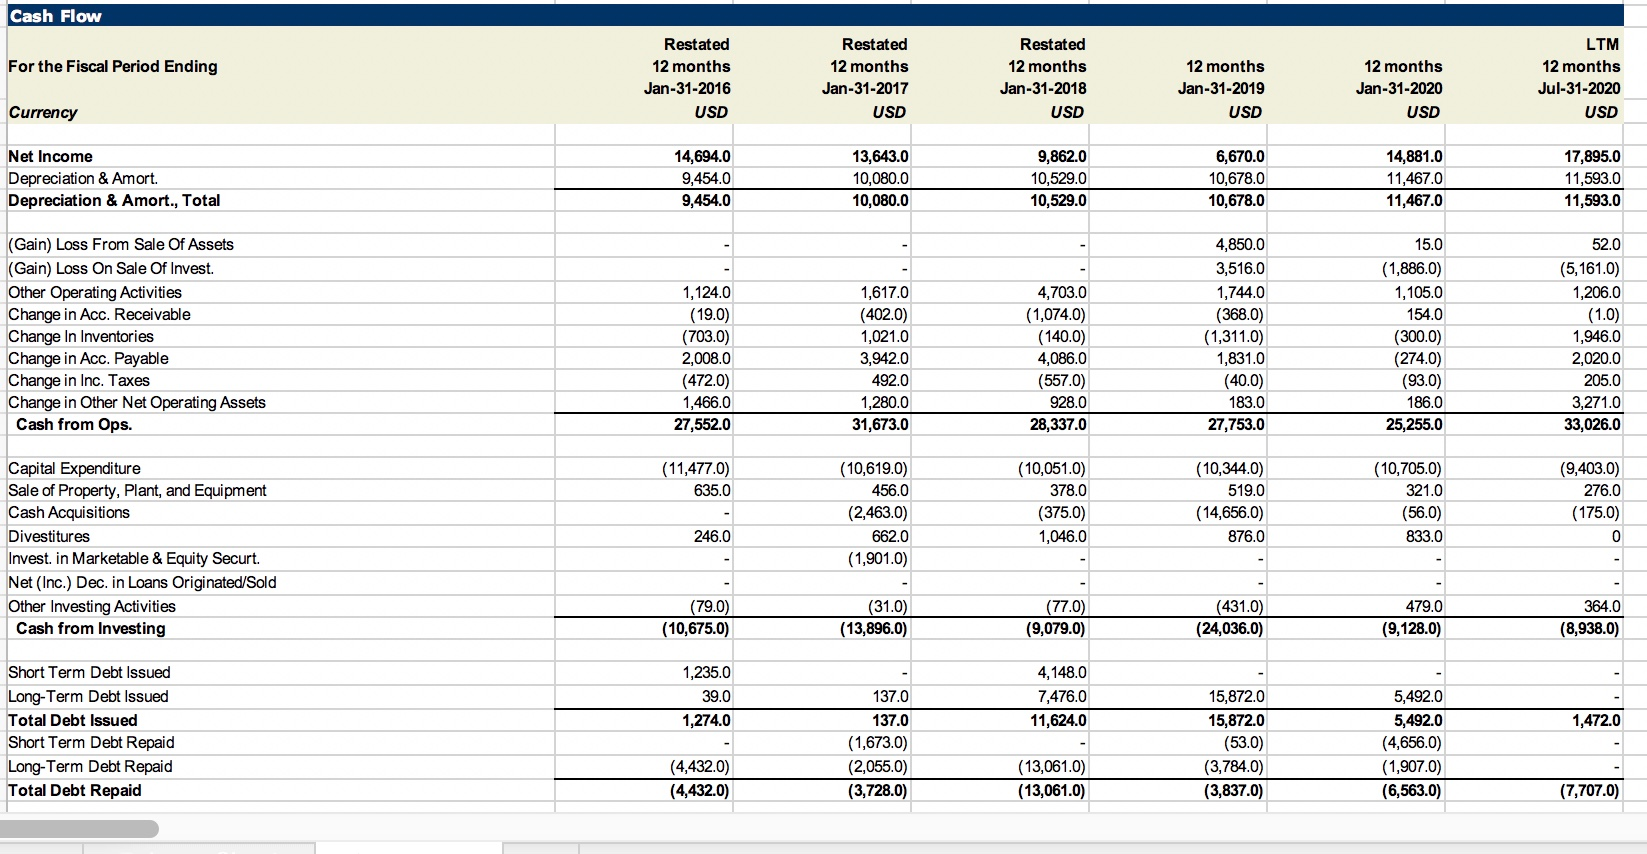
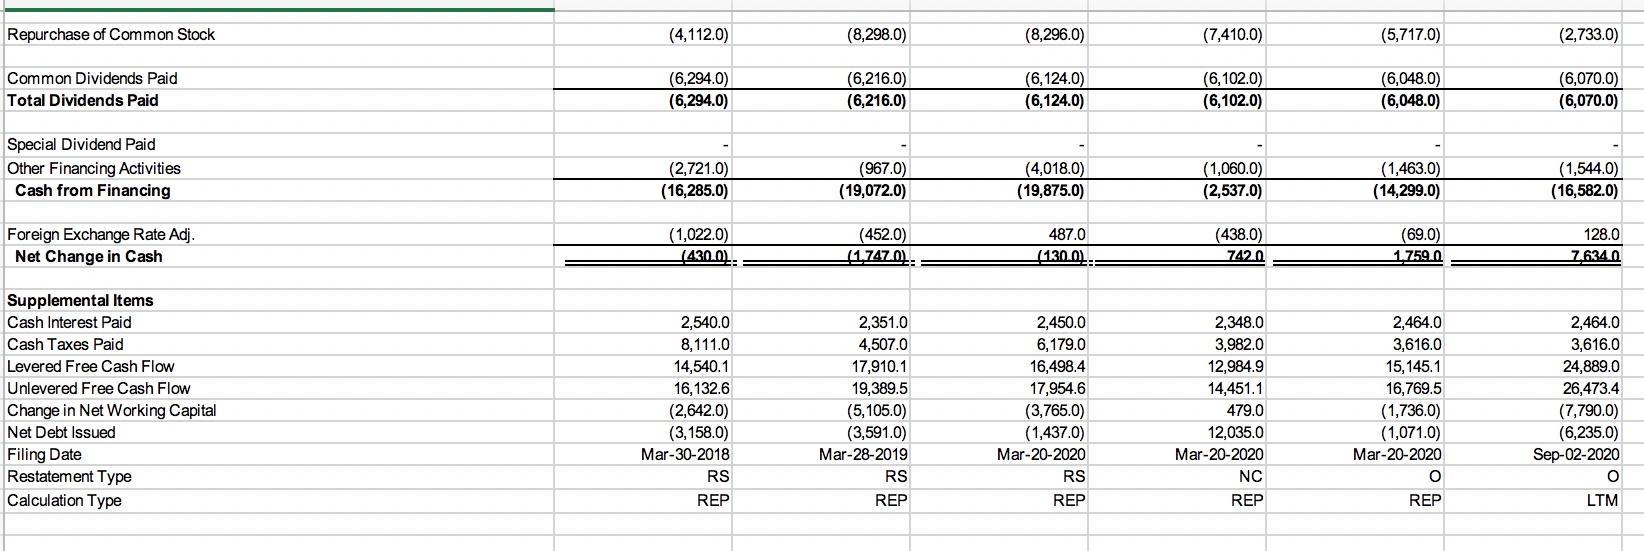
Cash Flow For the Fiscal Period Ending Restated 12 months Jan-31-2016 USD Restated 12 months Jan-31-2017 USD Restated 12 months Jan-31-2018 USD 12 months Jan-31-2019 USD 12 months Jan-31-2020 LTM 12 months Jul-31-2020 USD Currency USD Net Income Depreciation & Amort. Depreciation & Amort., Total 14,694.0 9,454.0 9,454.0 13,643.0 10,080.0 10,080.0 9,862.0 10,529.0 10,529.0 6,670.0 10,678.0 10,678.0 14,881.0 11,467.0 11,467.0 17,895.0 11,593.0 11,593.0 (Gain) Loss From Sale Of Assets (Gain) Loss On Sale Of Invest. Other Operating Activities Change in Acc. Receivable Change In Inventories Change in Acc. Payable Change in Inc. Taxes Change in Other Net Operating Assets Cash from Ops. 1,124.0 (19.0) (703.0) 2,008.0 (472.0) 1,466.0 27,552.0 1,617.0 (402.0) 1,021.0 3,942.0 492.0 1,280.0 31,673.0 4,703.0 (1,074.0) (140.0) 4,086.0 (557.0) 928.0 28,337.0 4,850.0 3,516.0 1,744.0 (368.0) (1,311.0) 1,831.0 (40.0) 183.0 27,753.0 15.0 (1,886.0) 1,105.0 154.0 (300.0) (274.0) (93.0) 186.0 25,255.0 52.0 (5,161.0) 1,206.0 (1.0) 1,946.0 2,020.0 205.0 3,271.0 33,026.0 (11,477.0) 635.0 (10,619.0) 456.0 (2,463.0) 662.0 (1,901.0) (10,051.0) 378.0 (375.0) 1,046.0 (10,344.0) 519.0 (14,656.0) 876.0 (10,705.0) 321.0 (56.0) 833.0 (9,403.0) 276.0 (175.0) 0 Capital Expenditure Sale of Property, Plant, and Equipment Cash Acquisitions Divestitures Invest. in Marketable & Equity Securt. Net (Inc.) Dec. in Loans Originated/Sold Other Investing Activities Cash from Investing 246.0 (79.0) (10,675.0) (31.0) (13,896.0) (77.0) (9,079.0) (431.0) (24,036.0) 479.0 (9,128.0) 364.0 (8,938.0) 1,235.0 39.0 1,274.0 4,148.0 7,476.0 11,624.0 1,472.0 Short Term Debt Issued Long-Term Debt Issued Total Debt Issued Short Term Debt Repaid Long-Term Debt Repaid Total Debt Repaid 137.0 137.0 (1,673.0) (2,055.0) (3,728.0) 15,872.0 15,872.0 (53.0) (3,784.0) (3,837.0) 5,492.0 5,492.0 (4,656.0) (1,907.0) (6,563.0) (4,432.0) (4,432.0) (13,061.0) (13,061.0) (7,707.0) Repurchase of Common Stock (4,112.0) (8,298.0) (8,296.0) (7,410.0) (5,717.0) (2,733.0) Common Dividends Paid Total Dividends Paid (6,294.0) (6,294.0) (6,216.0) (6,216.0) (6,124.0) (6,124.0) (6,102.0) (6,102.0) (6,048.0) (6,048.0) (6,070.0) (6,070.0) Special Dividend Paid Other Financing Activities Cash from Financing (2,721.0) (16,285.0) (967.0) (19,072.0) (4,018.0) (19,875.0) (1,060.0) (2,537.0) (1,463.0) (14,299.0) (1,544.0) (16,582.0) Foreign Exchange Rate Adj. Net Change in Cash (1,022.0) 1430.01. (452.0) (1.7470): 487.0 (130.01 (438.0) 7420 (69.0) 1,759.0 128.0 7.634.0 Supplemental Items Cash Interest Paid Cash Taxes Paid Levered Free Cash Flow Unlevered Free Cash Flow Change in Net Working Capital Net Debt Issued Filing Date Restatement Type Calculation Type 2,540.0 8,111.0 14,540.1 16,132.6 (2,642.0) (3,158.0) Mar-30-2018 RS REP 2,351.0 4,507.0 17,910.1 19,389.5 (5,105.0) (3,591.0) Mar-28-2019 RS REP 2,450.0 6,179.0 16,498.4 17,954.6 (3,765.0) (1,437.0) Mar-20-2020 RS REP 2,348.0 3,982.0 12,984.9 14,451.1 479.0 12,035.0 Mar-20-2020 NC REP 2,464.0 3,616.0 15,145.1 16,769.5 (1,736.0) (1,071.0) Mar-20-2020 O REP 2,464.0 3,616.0 24,889.0 26,473.4 (7,790.0) (6,235.0) Sep-02-2020 LTM Cash Flow For the Fiscal Period Ending Restated 12 months Jan-31-2016 USD Restated 12 months Jan-31-2017 USD Restated 12 months Jan-31-2018 USD 12 months Jan-31-2019 USD 12 months Jan-31-2020 LTM 12 months Jul-31-2020 USD Currency USD Net Income Depreciation & Amort. Depreciation & Amort., Total 14,694.0 9,454.0 9,454.0 13,643.0 10,080.0 10,080.0 9,862.0 10,529.0 10,529.0 6,670.0 10,678.0 10,678.0 14,881.0 11,467.0 11,467.0 17,895.0 11,593.0 11,593.0 (Gain) Loss From Sale Of Assets (Gain) Loss On Sale Of Invest. Other Operating Activities Change in Acc. Receivable Change In Inventories Change in Acc. Payable Change in Inc. Taxes Change in Other Net Operating Assets Cash from Ops. 1,124.0 (19.0) (703.0) 2,008.0 (472.0) 1,466.0 27,552.0 1,617.0 (402.0) 1,021.0 3,942.0 492.0 1,280.0 31,673.0 4,703.0 (1,074.0) (140.0) 4,086.0 (557.0) 928.0 28,337.0 4,850.0 3,516.0 1,744.0 (368.0) (1,311.0) 1,831.0 (40.0) 183.0 27,753.0 15.0 (1,886.0) 1,105.0 154.0 (300.0) (274.0) (93.0) 186.0 25,255.0 52.0 (5,161.0) 1,206.0 (1.0) 1,946.0 2,020.0 205.0 3,271.0 33,026.0 (11,477.0) 635.0 (10,619.0) 456.0 (2,463.0) 662.0 (1,901.0) (10,051.0) 378.0 (375.0) 1,046.0 (10,344.0) 519.0 (14,656.0) 876.0 (10,705.0) 321.0 (56.0) 833.0 (9,403.0) 276.0 (175.0) 0 Capital Expenditure Sale of Property, Plant, and Equipment Cash Acquisitions Divestitures Invest. in Marketable & Equity Securt. Net (Inc.) Dec. in Loans Originated/Sold Other Investing Activities Cash from Investing 246.0 (79.0) (10,675.0) (31.0) (13,896.0) (77.0) (9,079.0) (431.0) (24,036.0) 479.0 (9,128.0) 364.0 (8,938.0) 1,235.0 39.0 1,274.0 4,148.0 7,476.0 11,624.0 1,472.0 Short Term Debt Issued Long-Term Debt Issued Total Debt Issued Short Term Debt Repaid Long-Term Debt Repaid Total Debt Repaid 137.0 137.0 (1,673.0) (2,055.0) (3,728.0) 15,872.0 15,872.0 (53.0) (3,784.0) (3,837.0) 5,492.0 5,492.0 (4,656.0) (1,907.0) (6,563.0) (4,432.0) (4,432.0) (13,061.0) (13,061.0) (7,707.0) Repurchase of Common Stock (4,112.0) (8,298.0) (8,296.0) (7,410.0) (5,717.0) (2,733.0) Common Dividends Paid Total Dividends Paid (6,294.0) (6,294.0) (6,216.0) (6,216.0) (6,124.0) (6,124.0) (6,102.0) (6,102.0) (6,048.0) (6,048.0) (6,070.0) (6,070.0) Special Dividend Paid Other Financing Activities Cash from Financing (2,721.0) (16,285.0) (967.0) (19,072.0) (4,018.0) (19,875.0) (1,060.0) (2,537.0) (1,463.0) (14,299.0) (1,544.0) (16,582.0) Foreign Exchange Rate Adj. Net Change in Cash (1,022.0) 1430.01. (452.0) (1.7470): 487.0 (130.01 (438.0) 7420 (69.0) 1,759.0 128.0 7.634.0 Supplemental Items Cash Interest Paid Cash Taxes Paid Levered Free Cash Flow Unlevered Free Cash Flow Change in Net Working Capital Net Debt Issued Filing Date Restatement Type Calculation Type 2,540.0 8,111.0 14,540.1 16,132.6 (2,642.0) (3,158.0) Mar-30-2018 RS REP 2,351.0 4,507.0 17,910.1 19,389.5 (5,105.0) (3,591.0) Mar-28-2019 RS REP 2,450.0 6,179.0 16,498.4 17,954.6 (3,765.0) (1,437.0) Mar-20-2020 RS REP 2,348.0 3,982.0 12,984.9 14,451.1 479.0 12,035.0 Mar-20-2020 NC REP 2,464.0 3,616.0 15,145.1 16,769.5 (1,736.0) (1,071.0) Mar-20-2020 O REP 2,464.0 3,616.0 24,889.0 26,473.4 (7,790.0) (6,235.0) Sep-02-2020 LTM