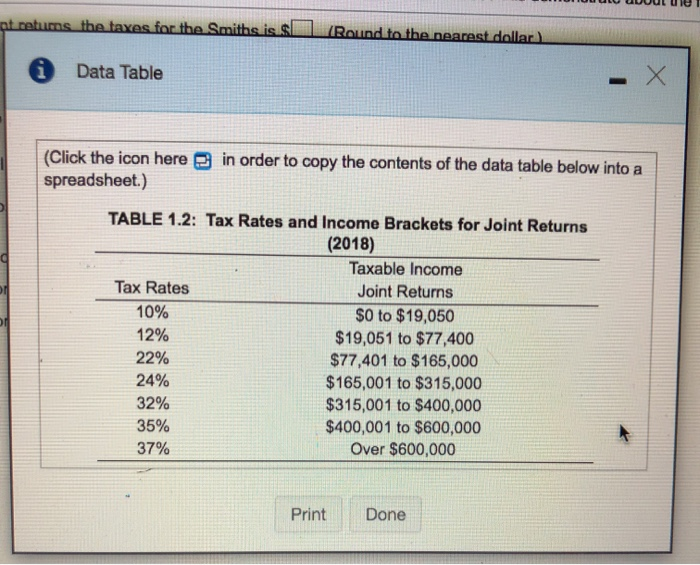
During 2018, the Smiths and the Joneses both fled tax returns. For the tax year ended December 31, 2018, the mixable income was $12,000, and the Jones had totalable income of 61.500 a. Using the federal tax rates given in Table 12. m. for married couples fling joint returns, calculate the taxes for both the Smiths and the Joneses b. Calculate and compare the ratio of the Smiths' to the Joneses taxable income and the ratio of the Smiths' to the Joneses taxes. What does this demonstrate about the federal income tax structure? aUsing the federal tax rates given in Table 12 for married couples fing joint returns, the tes for the Smiths is $). (Round to the nearest dolar) The taxes for the Joneses is $(Round to the nearest dollar) b. The ratio of the Smiths to the Jones' wable income is (Round to two decimal places) The ratio of the Smiths' to the Joneses taxes is (Round to two decimal place) What does this demonstrate about the federal income tax structure? (Choose the best answer below) O A. Those who can higher incomes pay a higher proportion of their income in taxes OB. Those who eam lower income pay a higher proportion of their income in C. Those who ear higher incomes pay a lower proportion of their income in the OD. Everyone pays the same proportion of their income in taxes pt returns the taxes for the Smiths is. Round to the nearest dollar Data Table (Click the icon here spreadsheet.) in order to copy the contents of the data table below into a TABLE 1.2: Tax Rates and Income Brackets for Joint Returns (2018) Taxable Income Tax Rates Joint Returns 10% $0 to $19,050 12% $19,051 to $77,400 22% $77,401 to $165,000 24% $165,001 to $315,000 32% $315,001 to $400,000 35% $400,001 to $600,000 37% Over $600,000 Print Done