

Answered step by step
Verified Expert Solution
Question
1 Approved Answer
e Please calculate the change in profitability and asset utilization for the base year 2018 in a percentage f. Perform a percent change analysis. What
e 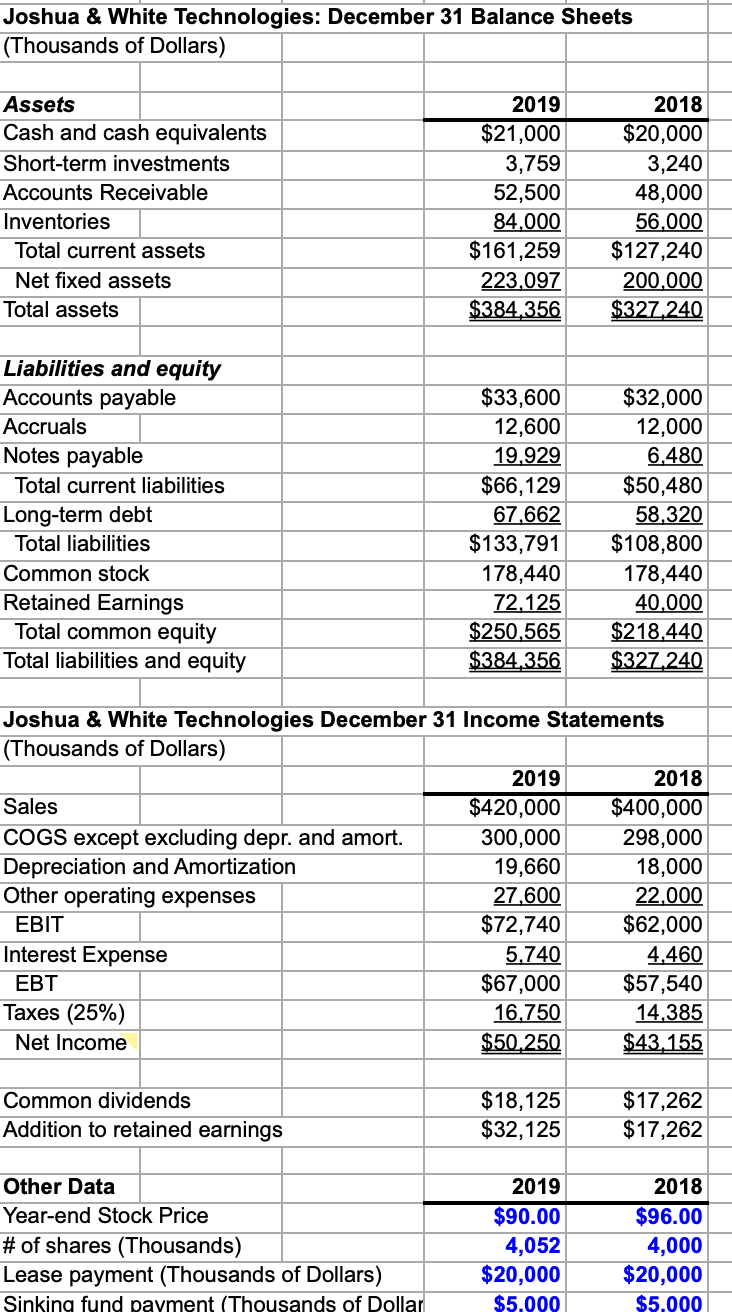
Please calculate the change in profitability and asset utilization for the base year 2018 in a percentage
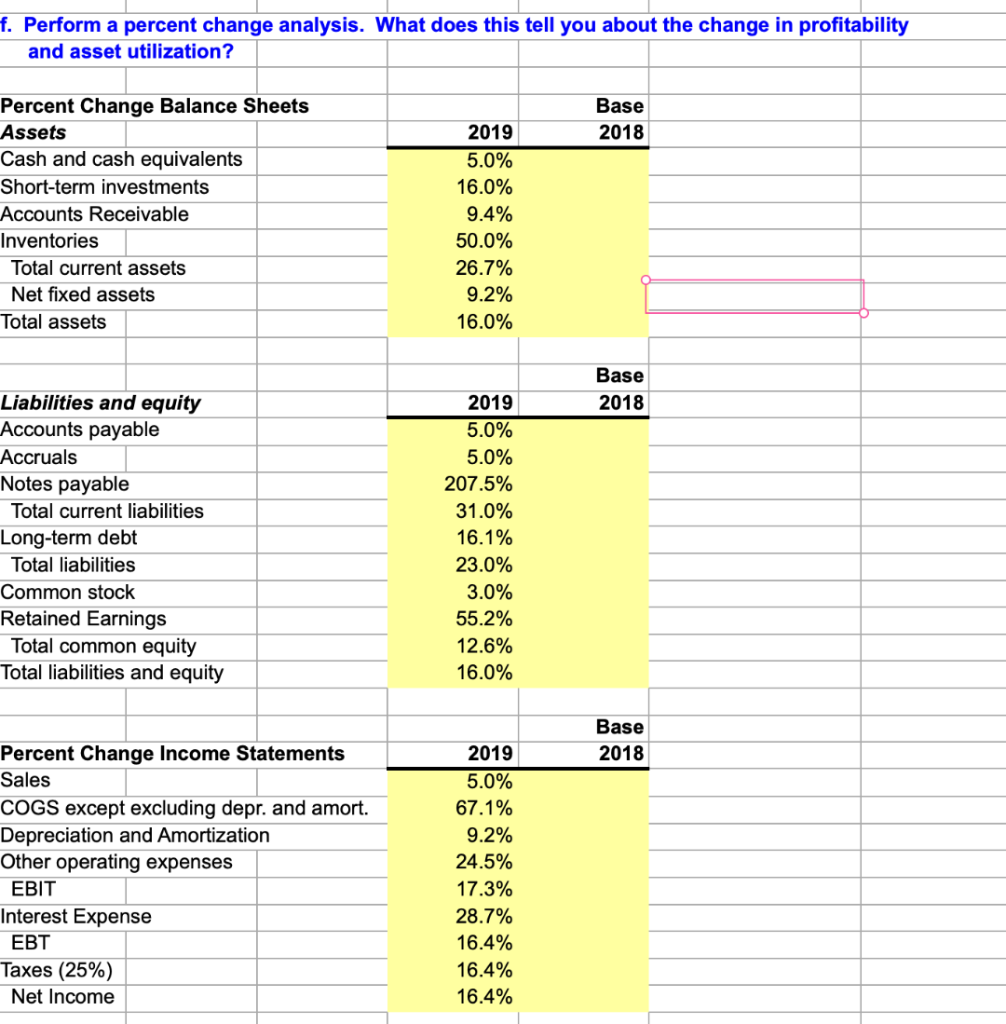
f. Perform a percent change analysis. What does this tell you about the change in profitability and asset utilization? Base 2018 Percent Change Balance Sheets Assets Cash and cash equivalents Short-term investments Accounts Receivable Inventories Total current assets Net fixed assets Total assets 2019 5.0% 16.0% 9.4% 50.0% 26.7% 9.2% 16.0% Base 2018 Liabilities and equity Accounts payable Accruals Notes payable Total current liabilities Long-term debt Total liabilities Common stock Retained Earnings Total common equity Total liabilities and equity 2019 5.0% 5.0% 207.5% 31.0% 16.1% 23.0% 3.0% 55.2% 12.6% 16.0% Base 2018 Percent Change Income Statements Sales COGS except excluding depr. and amort. Depreciation and Amortization Other operating expenses EBIT Interest Expense EBT Taxes (25%) Net Income 2019 5.0% 67.1% 9.2% 24.5% 17.3% 28.7% 16.4% 16.4% 16.4% Joshua & White Technologies: December 31 Balance Sheets (Thousands of Dollars) Assets Cash and cash equivalents Short-term investments Accounts Receivable Inventories Total current assets Net fixed assets Total assets 2019 $21,000 3,759 52,500 84.000 $161,259 223,097 $384.356 2018 $20,000 3,240 48,000 56,000 $127,240 200,000 $327.240 Liabilities and equity Accounts payable Accruals Notes payable Total current liabilities Long-term debt Total liabilities Common stock Retained Earnings Total common equity Total liabilities and equity $33,600 12,600 19,929 $66,129 67,662 $133,791 178,440 72,125 $250,565 $384.356 $32,000 12,000 6,480 $50,480 58,320 $108,800 178,440 40,000 $218,440 $327,240 Joshua & White Technologies December 31 Income Statements (Thousands of Dollars) 2019 2018 Sales $420,000 $400,000 COGS except excluding depr. and amort. 300,000 298,000 Depreciation and Amortization 19,660 18,000 Other operating expenses 27,600 22.000 EBIT $72,740 $62,000 Interest Expense 5,740 4,460 EBT $67,000 $57,540 Taxes (25%) 16.750 14,385 Net Income $50,250 $43,155 Common dividends Addition to retained earnings $18,125 $32,125 $17,262 $17,262 Other Data Year-end Stock Price # of shares (Thousands) Lease payment (Thousands of Dollars) Sinking fund payment (Thousands of Dollar 2019 $90.00 4,052 $20,000 $5.000 2018 $96.00 4,000 $20,000 $5.000 f. Perform a percent change analysis. What does this tell you about the change in profitability and asset utilization? Base 2018 Percent Change Balance Sheets Assets Cash and cash equivalents Short-term investments Accounts Receivable Inventories Total current assets Net fixed assets Total assets 2019 5.0% 16.0% 9.4% 50.0% 26.7% 9.2% 16.0% Base 2018 Liabilities and equity Accounts payable Accruals Notes payable Total current liabilities Long-term debt Total liabilities Common stock Retained Earnings Total common equity Total liabilities and equity 2019 5.0% 5.0% 207.5% 31.0% 16.1% 23.0% 3.0% 55.2% 12.6% 16.0% Base 2018 Percent Change Income Statements Sales COGS except excluding depr. and amort. Depreciation and Amortization Other operating expenses EBIT Interest Expense EBT Taxes (25%) Net Income 2019 5.0% 67.1% 9.2% 24.5% 17.3% 28.7% 16.4% 16.4% 16.4% Joshua & White Technologies: December 31 Balance Sheets (Thousands of Dollars) Assets Cash and cash equivalents Short-term investments Accounts Receivable Inventories Total current assets Net fixed assets Total assets 2019 $21,000 3,759 52,500 84.000 $161,259 223,097 $384.356 2018 $20,000 3,240 48,000 56,000 $127,240 200,000 $327.240 Liabilities and equity Accounts payable Accruals Notes payable Total current liabilities Long-term debt Total liabilities Common stock Retained Earnings Total common equity Total liabilities and equity $33,600 12,600 19,929 $66,129 67,662 $133,791 178,440 72,125 $250,565 $384.356 $32,000 12,000 6,480 $50,480 58,320 $108,800 178,440 40,000 $218,440 $327,240 Joshua & White Technologies December 31 Income Statements (Thousands of Dollars) 2019 2018 Sales $420,000 $400,000 COGS except excluding depr. and amort. 300,000 298,000 Depreciation and Amortization 19,660 18,000 Other operating expenses 27,600 22.000 EBIT $72,740 $62,000 Interest Expense 5,740 4,460 EBT $67,000 $57,540 Taxes (25%) 16.750 14,385 Net Income $50,250 $43,155 Common dividends Addition to retained earnings $18,125 $32,125 $17,262 $17,262 Other Data Year-end Stock Price # of shares (Thousands) Lease payment (Thousands of Dollars) Sinking fund payment (Thousands of Dollar 2019 $90.00 4,052 $20,000 $5.000 2018 $96.00 4,000 $20,000 $5.000Step by Step Solution
There are 3 Steps involved in it
Step: 1

Get Instant Access to Expert-Tailored Solutions
See step-by-step solutions with expert insights and AI powered tools for academic success
Step: 2

Step: 3
Ace Your Homework with AI
Get the answers you need in no time with our AI-driven, step-by-step assistance
Get Started
Finance And Sustainability
Authors: William Sun, Celine Louche, Roland Perez
1st Edition
1780520921, 978-1780520926