Answered step by step
Verified Expert Solution
Question
1 Approved Answer
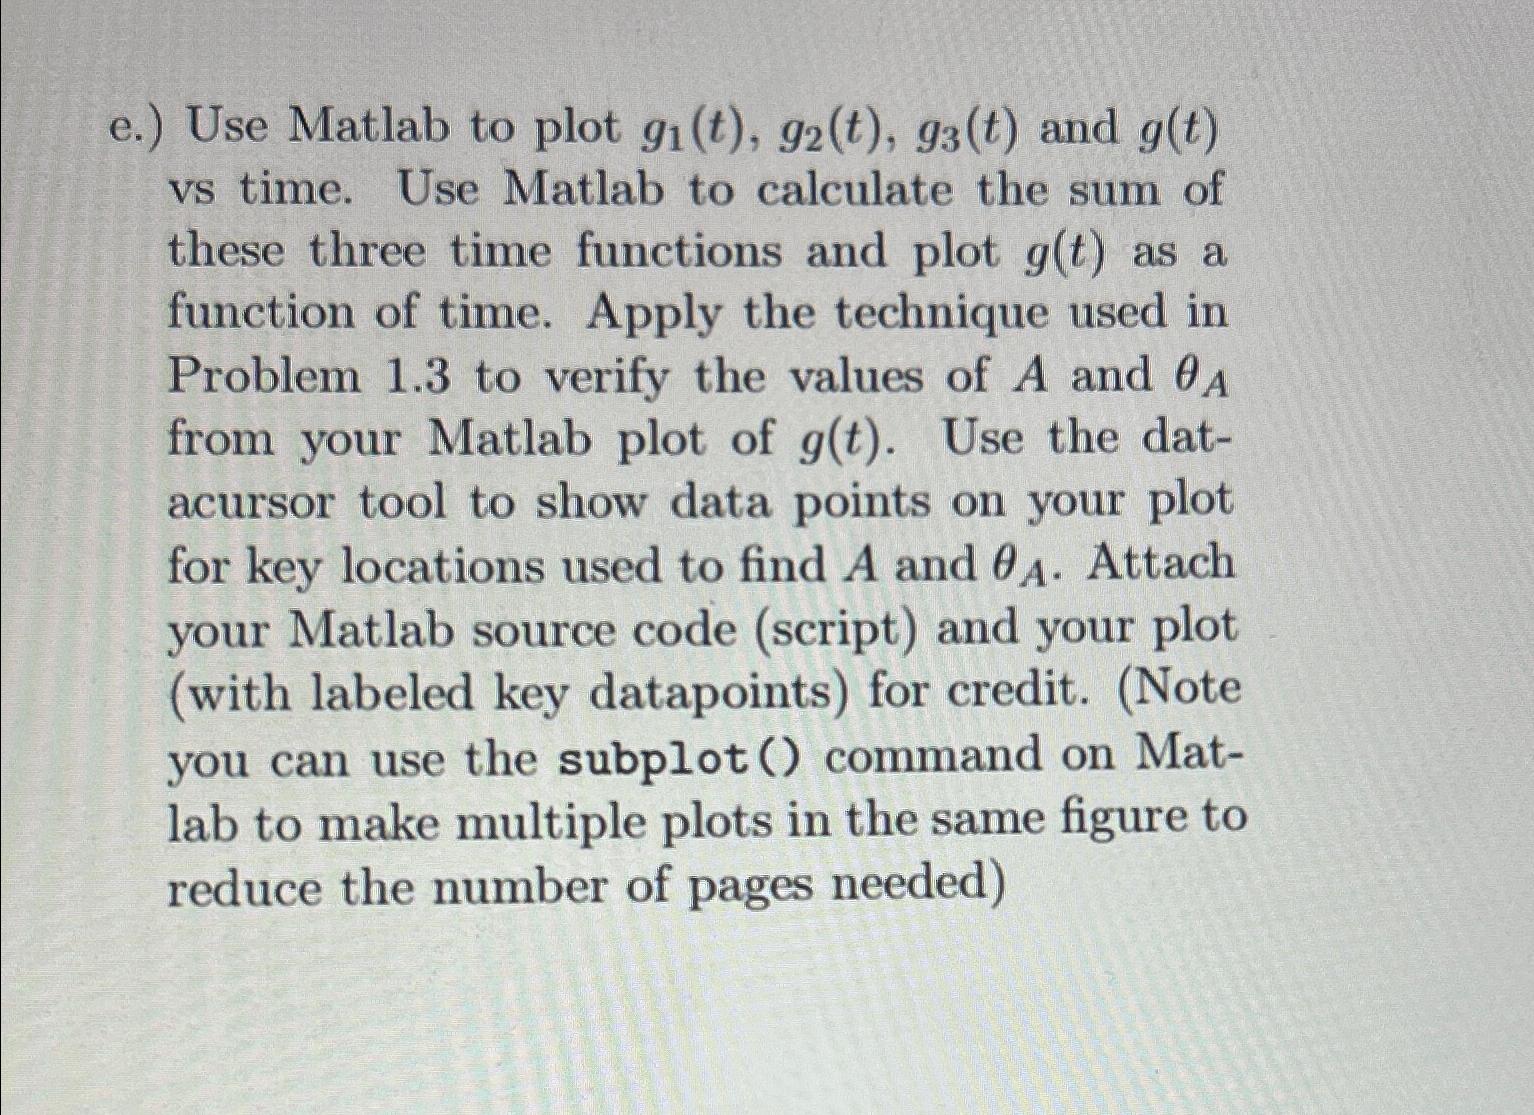
e . ) Use Matlab to plot g 1 ( t ) , g 2 ( t ) , g 3 ( t ) and
e Use Matlab to plot and vs time. Use Matlab to calculate the sum of these three time functions and plot as a function of time. Apply the technique used in Problem to verify the values of A and from your Matlab plot of Use the datacursor tool to show data points on your plot for key locations used to find A and Attach your Matlab source code script and your plot with labeled key datapoints for credit. Note you can use the subplot command on Matlab to make multiple plots in the same figure to reduce the number of pages needed

Step by Step Solution
There are 3 Steps involved in it
Step: 1

Get Instant Access to Expert-Tailored Solutions
See step-by-step solutions with expert insights and AI powered tools for academic success
Step: 2

Step: 3

Ace Your Homework with AI
Get the answers you need in no time with our AI-driven, step-by-step assistance
Get Started


