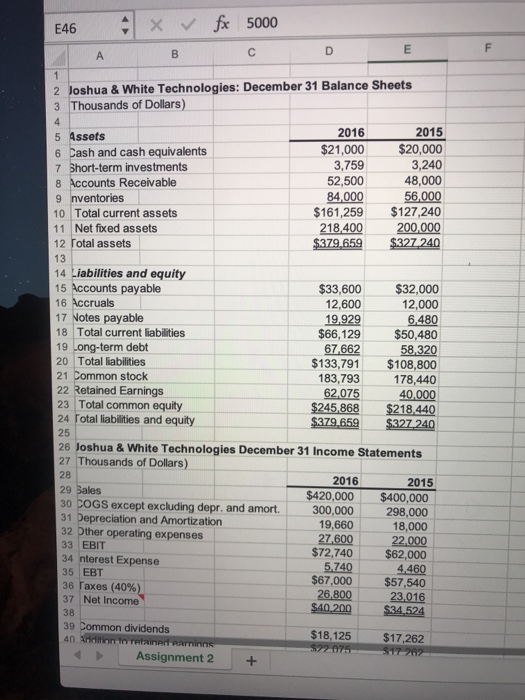
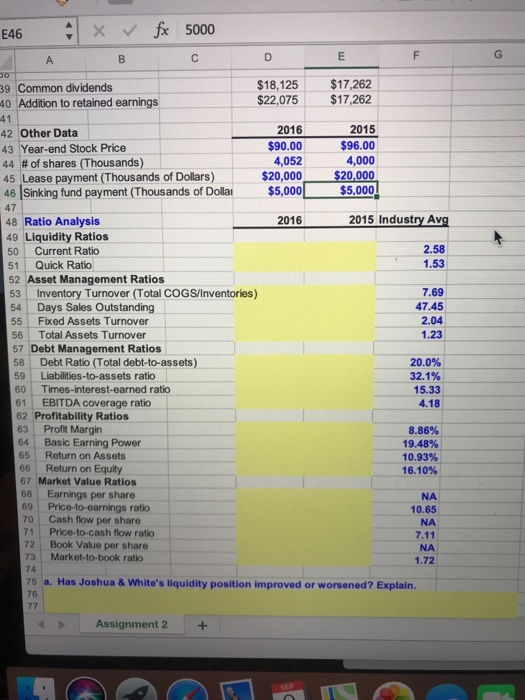
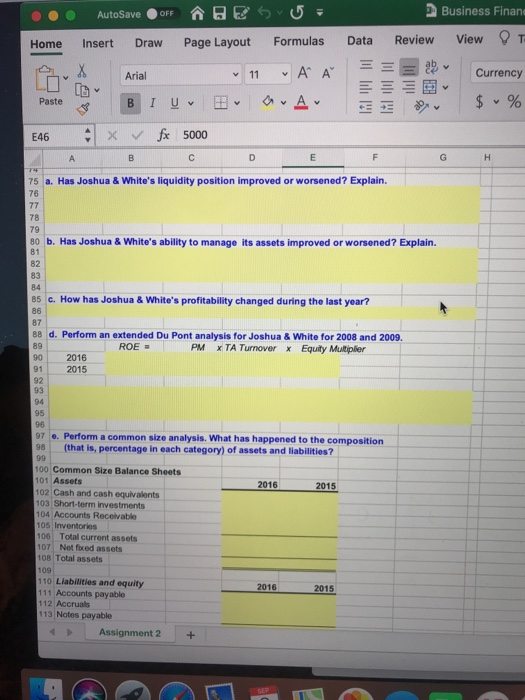
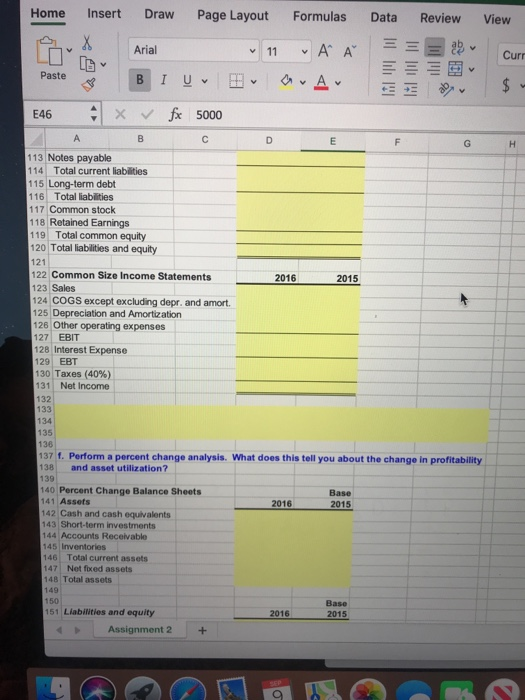
E46 5000 X & fx F B D A E 1 2 Joshua & White Technologies: December 31 Balance Sheets 3 Thousands of Dollars) 4 5 Assets 2016 2015 6 Cash and cash equivalents $21,000 $20,000 7 Short-term investments 3,759 3,240 8 Accounts Receivable 52,500 48,000 9nventories 84,000 56,000 10 Total current assets $161,259 $127,240 11 Net fixed assets 218,400 200,000 12 Total assets $379,659 $327 240 13 14 Liabilities and equity 15 Accounts payable $33,600 $32,000 16 Accruals 12,600 12,000 17 Notes payable 19.929 6,480 18 Total current liabilities $66,129 $50,480 19 Long-term debt 67,662 58,320 20 Total liabilities $133,791 $108,800 21 Common stock 183,793 178,440 22 Retained Earnings 62.075 40.000 23 Total common equity $245,868 $218,440 24 Total liabilities and equity $379,659 $327.240 25 26 Joshua & White Technologies December 31 Income Statements 27 Thousands of Dollars) 28 2016 2015 29 Bales $420,000 $400,000 30 COGS except excluding depr. and amort. 300,000 298,000 31 Depreciation and Amortization 19,660 18,000 32 Other operating expenses 27600 22.000 33 EBIT $72,740 $62,000 34 nterest Expense 5.740 4,460 35 EBT $67,000 $57,540 36 Taxes (40%) 26.800 37 Net Income 23,016 $40.200 $34.524 38 39 Common dividends 40 Ardition to retained earnings $18,125 $17,262 522.075 $17.262 Assignment 2 + E46 X fx 5000 B D E F 39 Common dividends $18,125 $17,262 40 Addition to retained earnings $22,075 $17,262 41 42 Other Data 2016 2015 43 Year-end Stock Price $90.00 $96.00 44 # of shares (Thousands) 4,052 4,000 45 Lease payment (Thousands of Dollars) $20,000 $20,000 46 (Sinking fund payment (Thousands of Dollar $5,000 $5,000 47 48 Ratio Analysis 2016 2015 Industry Avg 49 Liquidity Ratios 50 Current Ratio 2.58 51 Quick Ratio 1.53 52 Asset Management Ratios 53 Inventory Turnover (Total COGS/Inventories) 7.69 54 Days Sales Outstanding 47.45 55 Fixed Assets Turnover 2.04 56 Total Assets Turnover 1.23 57 Debt Management Ratios 58 Debt Ratio (Total debt-to-assets) 20.0% 59 Liabilities-to-assets ratio 32.1% 60 Times-interest-earned ratio 15.33 61 EBITDA coverage ratio 4.18 62 Profitability Ratios 63 Profit Margin 8.86% 64 Basic Earning Power 19.48% 65 Return on Assets 10.93% 66 Return on Equity 16.10% 67 Market Value Ratios 68 Earnings per share NA 89 Price-to-earnings ratio 10.65 Cash flow per share NA 71 Price-to-cash flow ratio 7.11 72 Book Value per share NA 73 Market-to-book ratio 1.72 74 75 a. Has Joshua & White's liquidity position improved or worsened? Explain. 76 77 70 Assignment 2 + AutoSave OFF Business Finan Insert Home Draw Page Layout Formulas Data Review View OT v Arial 11 V A Currency [D v Paste B 1 Uv Av $ % E46 fx 5000 B C D E F G H 75 a. Has Joshua & White's liquidity position improved or worsened? Explain. 76 77 78 79 80 b. Has Joshua & White's ability to manage its assets improved or worsened? Explain. 81 82 83 84 85 c. How has Joshua & White's profitability changed during the last year? 86 87 88 d. Perform an extended Du Pont analysis for Joshua & White for 2008 and 2009. 89 ROE PM XTA Turnover X Equity Multiplier 90 2016 91 2015 92 93 95 96 97 Perform a common size analysis. What has happened to the composition 98 (that is, percentage in each category) of assets and liabilities? 99 100 Common Size Balance Sheets 101 Assets 2016 2015 102 Cash and cash equivalents 103 Short-term investments 104 Accounts Receivable 105 Inventories 100 Total current assets 107 Net foxed assets 108 Total assets 109 110 Liabilities and equity 2016 2015 111 Accounts payable 112 Accruals 113 Notes payable Assignment 2 + Home Insert Draw Page Layout Formulas Data Review View X Arial v 11 v A Curr IMMO Paste II III B I U v av Av $ E46 A x V fx 5000 D E F G H 2016 2015 B 113 Notes payable 114 Total current liabilities 115 Long-term debt 116 Total liabilities 117 Common stock 118 Retained Earnings 119 Total common equity 120 Total liabilities and equity 121 122 Common Size Income Statements 123 Sales 124 COGS except excluding depr. and amort. 125 Depreciation and Amortization 126 Other operating expenses 127 EBIT 128 Interest Expense 129 EBT 130 Taxes (40%) 131 Net Income 132 133 134 135 136 137 1. Perform a percent change analysis. What does this tell you about the change in profitability 138 and asset utilization? 139 140 Percent Change Balance Sheets Base 141 Assets 2016 2015 142 Cash and cash equivalents 143 Short-term investments 144 Accounts Receivable 145 Inventories 146 Total current assets 147 Not fixed assets 148 Total assets 149 150 Base 151 Llabilities and equity 2016 2015 Assignment 2 + F Excel File Edit View Insert Format Tools Data Window Help Business Finance Assign AutoSave OFF DESU Page Layout Formulas Home Insert Draw Data Review View Tell me X v Arial 11 A Currency Paste B I av $ % ) E46 x fx 5000 B D E F G H 1 Base 2015 2016 150 151 Liabilities and equity 152 Accounts payable 153 Accruals 154 Notes payable 155 Total current liabilities 156 Long-term debt 157 Total liabilities 158 Common stock 159 Retained Earnings 160 Total common equity 161 Total abilities and equity 162 163 164 Percent Change Income Statements 165 Sales 166 COGS except excluding depr. and amort. 167 Depreciation and Amortization 168 Other operating expenses 169 EBIT 170 Interest Expense 171 EBT 172 Taxes (40%) 173 Not Income 174 175 176 177 178 179 180 2016 Base 2015 183 184 185 186 187 188 Assignment 2