

Answered step by step
Verified Expert Solution
Question
1 Approved Answer
Each month, a government agency releases its latest estimate of construction activity in the housing industry. A key measure is the percentage change in
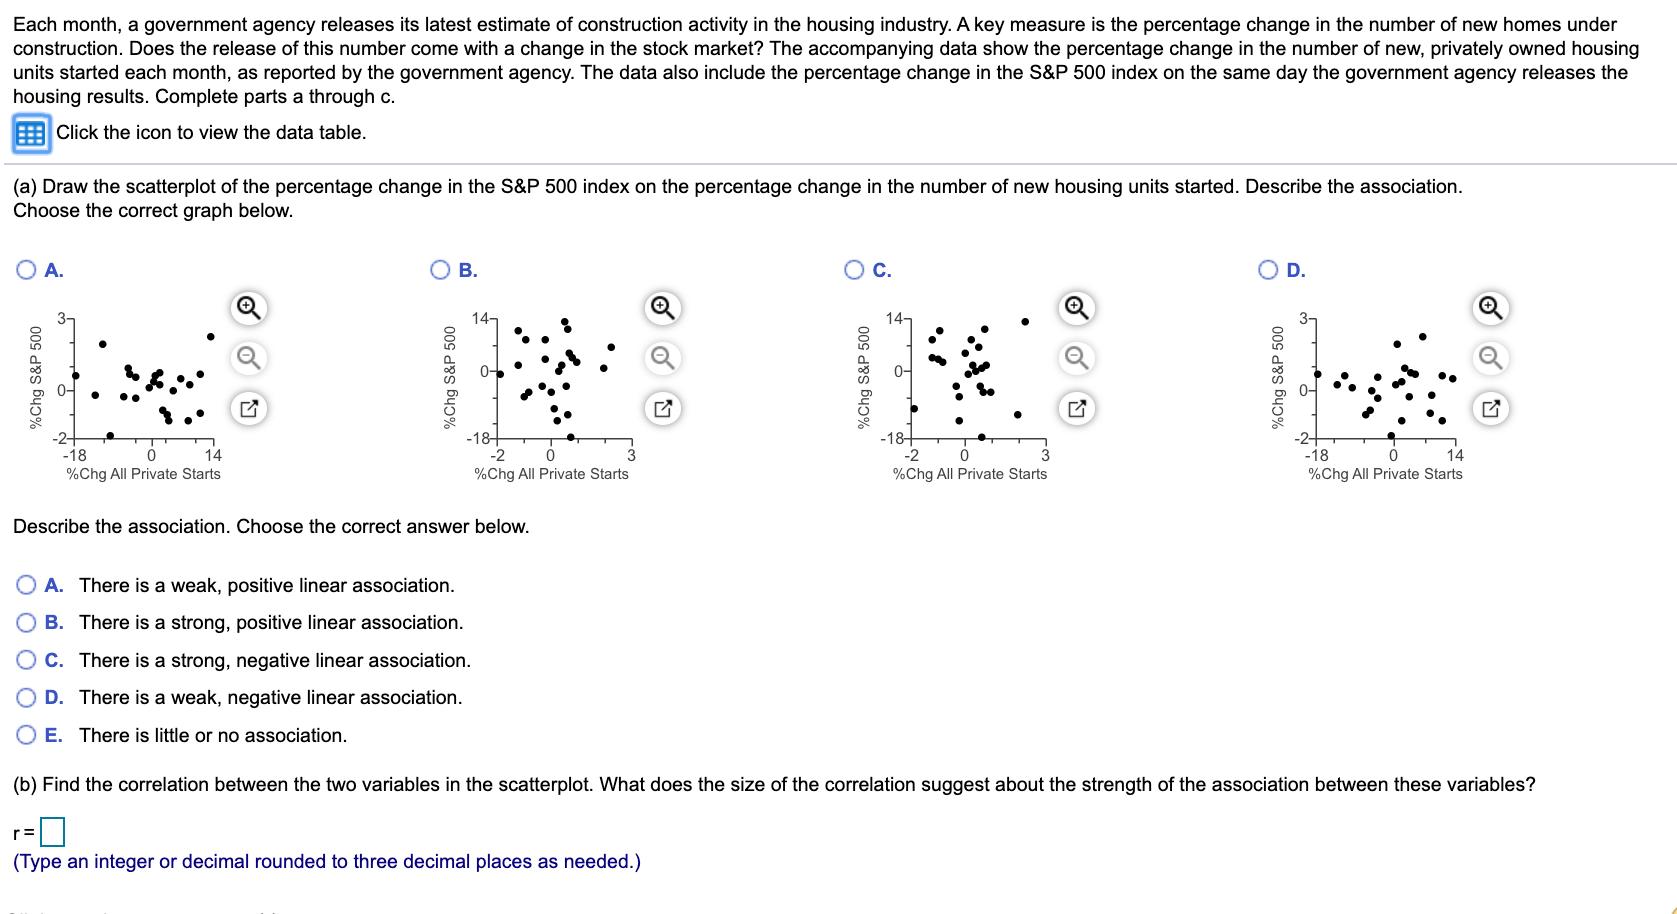
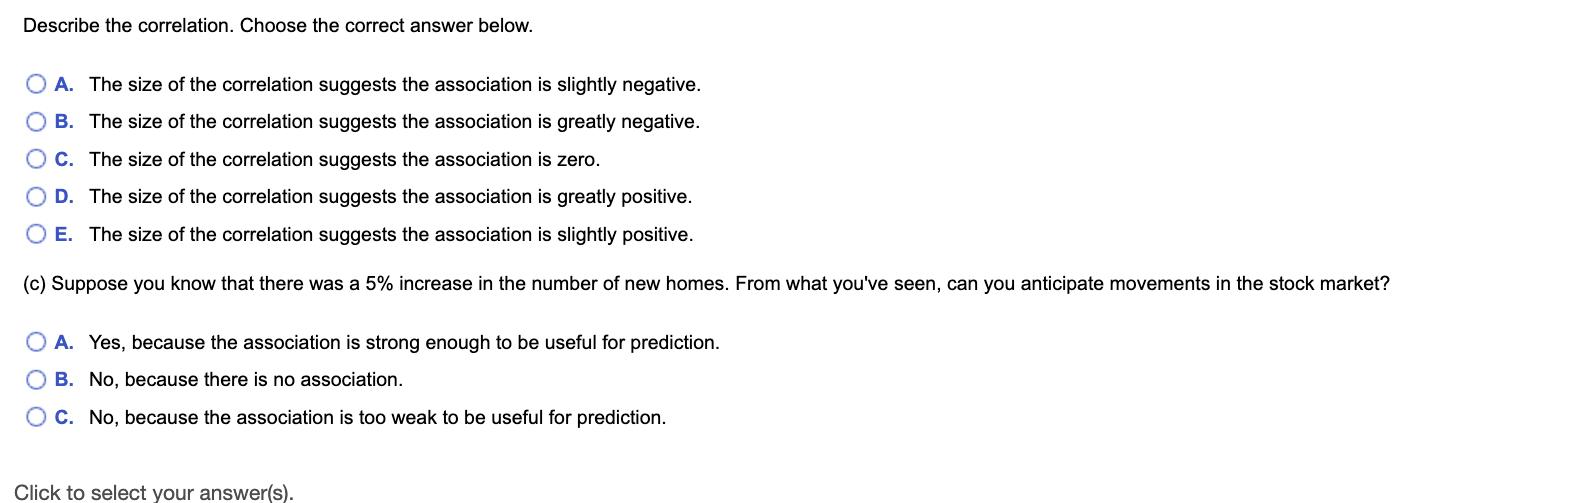
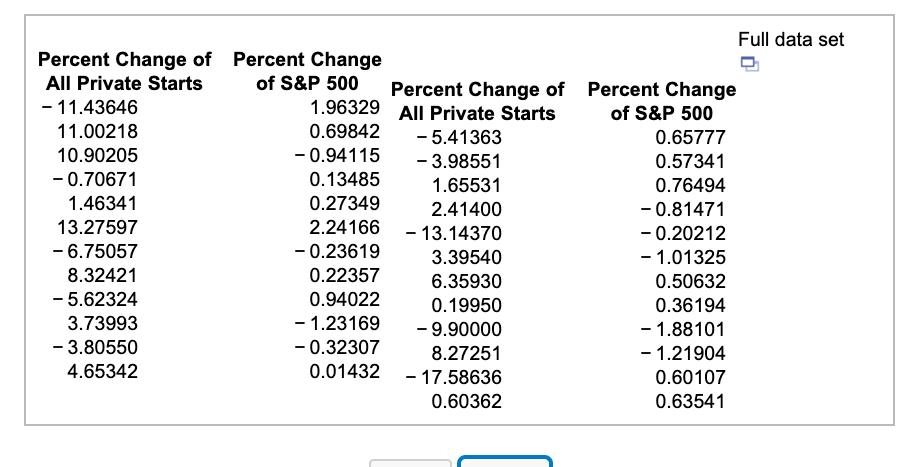
Each month, a government agency releases its latest estimate of construction activity in the housing industry. A key measure is the percentage change in the number of new homes under construction. Does the release of this number come with a change in the stock market? The accompanying data show the percentage change in the number of new, privately owned housing units started each month, as reported by the government agency. The data also include the percentage change in the S&P 500 index on the same day the government agency releases the housing results. Complete parts a through c. Click the icon to view the data table. (a) Draw the scatterplot of the percentage change in the S&P 500 index on the percentage change in the number of new housing units started. Describe the association. Choose the correct graph below. OA. . Oc. D. 0- . -18- -2 -18- -2 -18 14 -18 14 %Chg All Private Starts %Chg All Private Starts %Chg All Private Starts %Chg All Private Starts Describe the association. Choose the correct answer below. O A. There is a weak, positive linear association. B. There is a strong, positive linear association. C. There is a strong, negative linear association. D. There is a weak, negative linear association. E. There is little or no association. (b) Find the correlation between the two variables in the scatterplot. What does the size of the correlation suggest about the strength of the association between these variables? (Type an integer or decimal rounded to three decimal places as needed.) Describe the correlation. Choose the correct answer below. O A. The size of the correlation suggests the association is slightly negative. O B. The size of the correlation suggests the association is greatly negative. O C. The size of the correlation suggests the association is zero. O D. The size of the correlation suggests the association is greatly positive. O E. The size of the correlation suggests the association is slightly positive. (c) Suppose you know that there was a 5% increase in the number of new homes. From what you've seen, can you anticipate movements in the stock market? O A. Yes, because the association is strong enough to be useful for prediction. O B. No, because there is no association. C. No, because the association is too weak to be useful for prediction. Click to select your answer(s). Full data set Percent Change of Percent Change All Private Starts of S&P 500 1.96329 All Private Starts Percent Change of Percent Change of S&P 500 - 11.43646 11.00218 0.69842 - 5.41363 0.65777 10.90205 - 0.94115 - 3.98551 0.57341 - 0.70671 0.13485 1.65531 0.76494 1.46341 0.27349 2.41400 - 0.81471 13.27597 2.24166 - 13.14370 - 0.20212 - 6.75057 8.32421 - 0.23619 3.39540 - 1.01325 0.22357 6.35930 0.50632 - 5.62324 0.94022 0.19950 0.36194 3.73993 - 1.23169 - 9.90000 - 1.88101 - 3.80550 - 0.32307 8.27251 0.01432 - 17.58636 - 1.21904 4.65342 0.60107 0.60362 0.63541
Step by Step Solution
★★★★★
3.58 Rating (155 Votes )
There are 3 Steps involved in it
Step: 1
Answer the scatterplot is given by option C Scatterplot o...
Get Instant Access to Expert-Tailored Solutions
See step-by-step solutions with expert insights and AI powered tools for academic success
Step: 2

Step: 3
Ace Your Homework with AI
Get the answers you need in no time with our AI-driven, step-by-step assistance
Get Started
Statistics For Business Decision Making And Analysis
Authors: Robert Stine, Dean Foster
2nd Edition
978-0321836519, 321836510, 978-0321890269