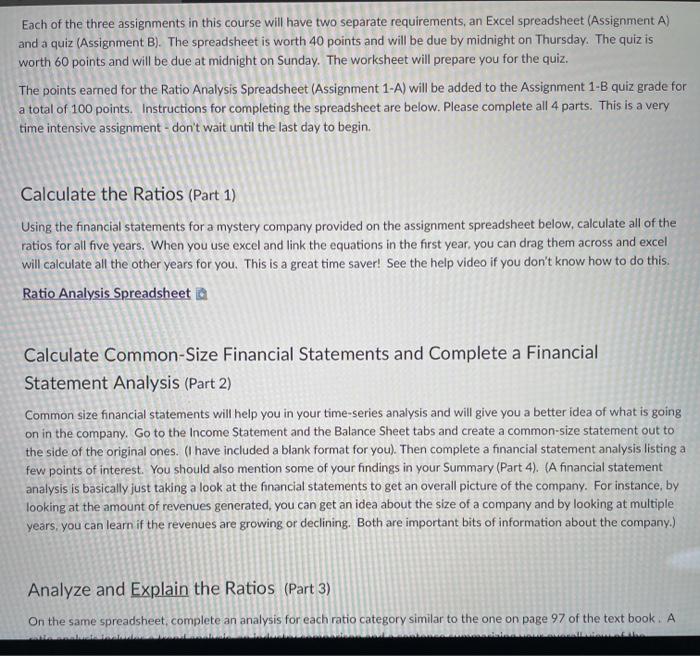
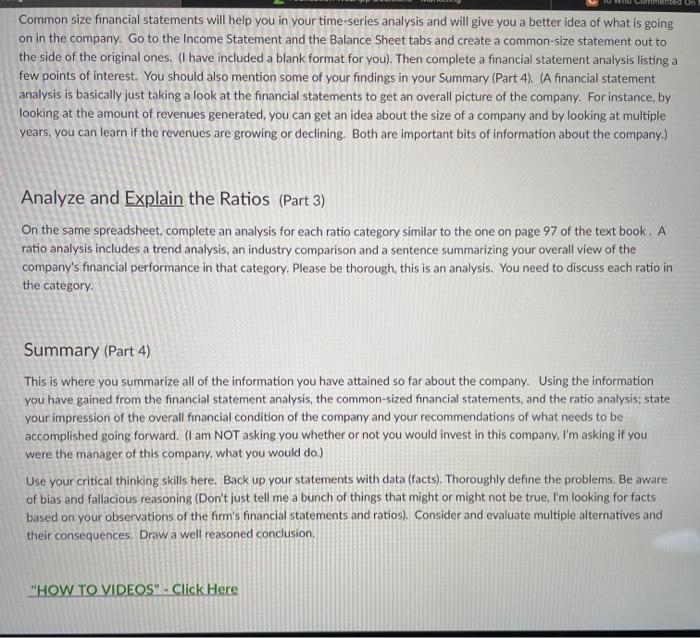
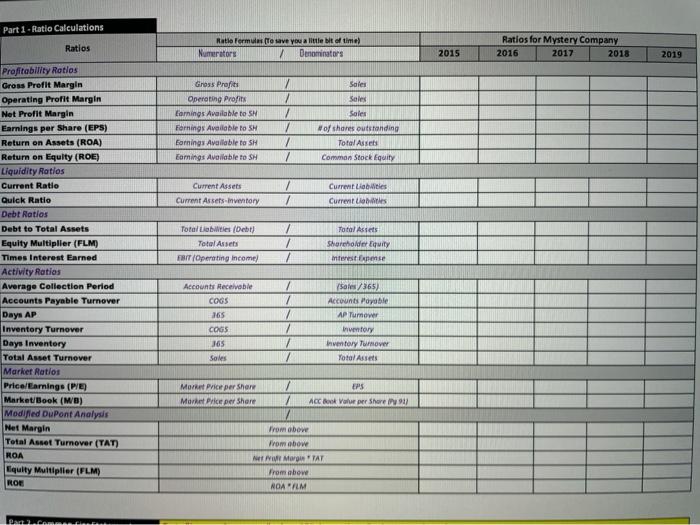
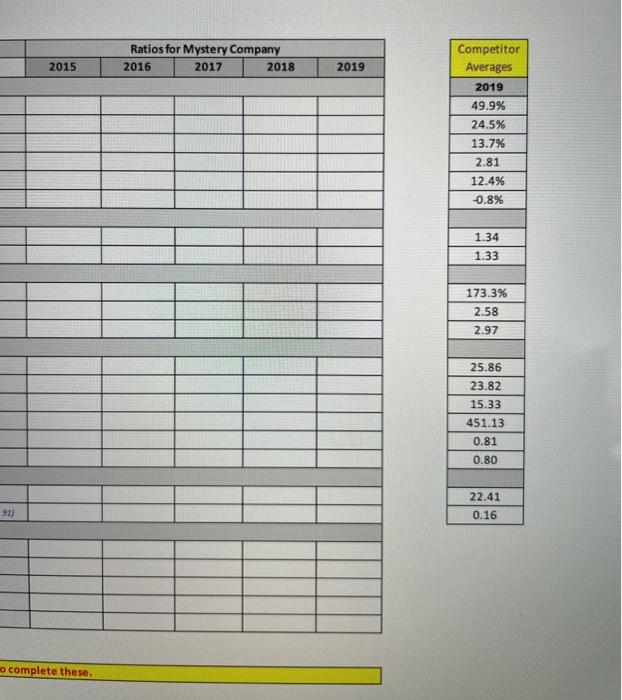
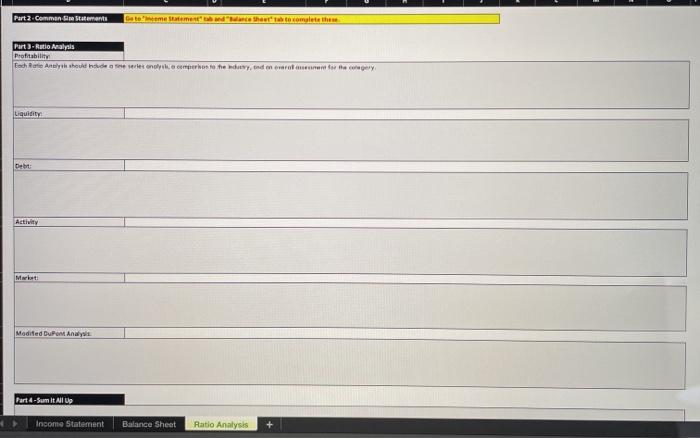
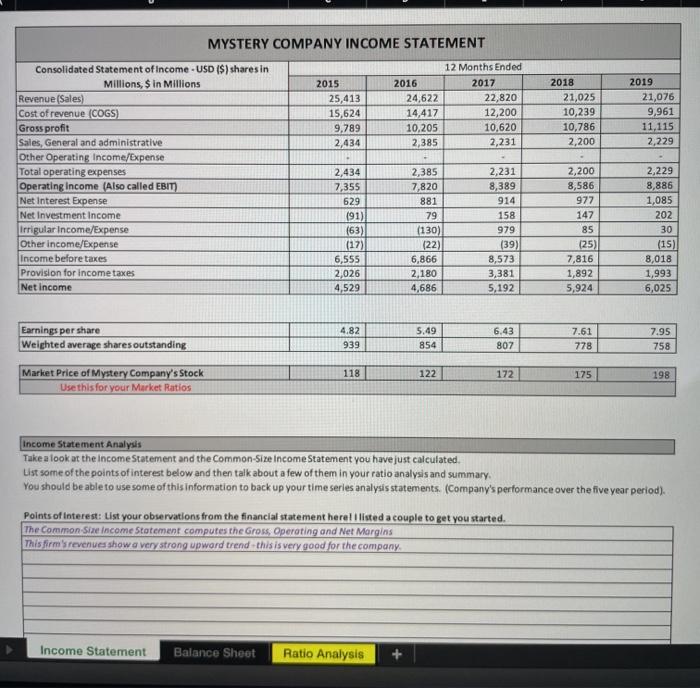
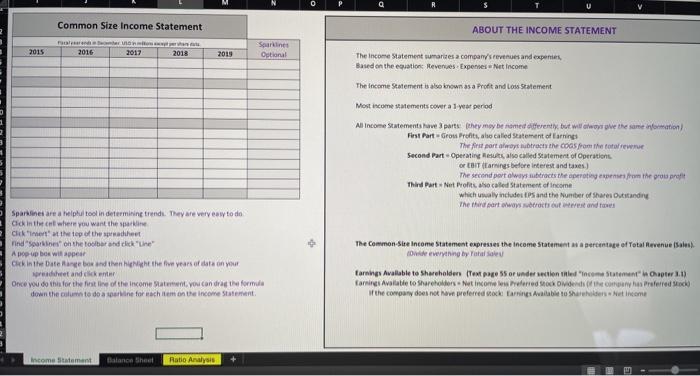
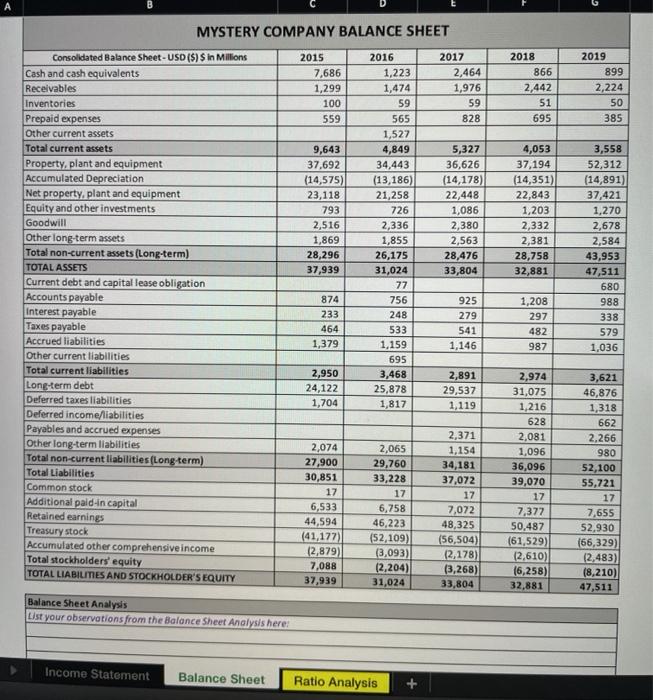
Each of the three assignments in this course will have two separate requirements, an Excel spreadsheet (Assignment A) and a quiz (Assignment B). The spreadsheet is worth 40 points and will be due by midnight on Thursday. The quiz is worth 60 points and will be due at midnight on Sunday. The worksheet will prepare you for the quiz. The points earned for the Ratio Analysis Spreadsheet (Assignment 1-A) will be added to the Assignment 1-B quiz grade for a total of 100 points. Instructions for completing the spreadsheet are below. Please complete all 4 parts. This is a very time intensive assignment - don't wait until the last day to begin. Calculate the Ratios (Part 1) Using the financial statements for a mystery company provided on the assignment spreadsheet below, calculate all of the ratios for all five years. When you use excel and link the equations in the first year, you can drag them across and excel will calculate all the other years for you. This is a great time saver! See the help video if you don't know how to do this. Ratio Analysis Spreadsheet a Calculate Common-Size Financial Statements and Complete a Financial Statement Analysis (Part 2) Common size financial statements will help you in your time-series analysis and will give you a better idea of what is going on in the company. Go to the Income Statement and the Balance Sheet tabs and create a common-size statement out to the side of the original ones. (have included a blank format for you). Then complete a financial statement analysis listing a few points of interest. You should also mention some of your findings in your Summary (Part 4). (A financial statement analysis is basically just taking a look at the financial statements to get an overall picture of the company. For instance, by looking at the amount of revenues generated, you can get an idea about the size of a company and by looking at multiple years, you can learn if the revenues are growing or declining. Both are important bits of information about the company.) Analyze and Explain the Ratios (Part 3) On the same spreadsheet, complete an analysis for each ratio category similar to the one on page 97 of the text book. A med Un Common size financial statements will help you in your time series analysis and will give you a better idea of what is going on in the company. Go to the Income Statement and the Balance Sheet tabs and create a common-size statement out to the side of the original ones. (I have included a blank format for you). Then complete a financial statement analysis listing a few points of interest. You should also mention some of your findings in your Summary (Part 4). (A financial statement analysis is basically just taking a look at the financial statements to get an overall picture of the company. For instance, by looking at the amount of revenues generated, you can get an idea about the size of a company and by looking at multiple years, you can learn if the revenues are growing or declining. Both are important bits of information about the company.) Analyze and Explain the Ratios (Part 3) On the same spreadsheet, complete an analysis for each ratio category similar to the one on page 97 of the text book. A ratio analysis includes a trend analysis, an industry comparison and a sentence summarizing your overall view of the company's financial performance in that category. Please be thorough, this is an analysis. You need to discuss each ratio in the category. Summary (Part 4) This is where you summarize all of the information you have attained so far about the company. Using the information you have gained from the financial statement analysis, the common-sized financial statements, and the ratio analysis: state your impression of the overall financial condition of the company and your recommendations of what needs to be accomplished going forward. (I am NOT asking you whether or not you would invest in this company, I'm asking if you were the manager of this company, what you would do.) Use your critical thinking skills here. Back up your statements with data (facts). Thoroughly define the problems. Be aware of bias and fallacious reasoning (Don't just tell me a bunch of things that might or might not be true, I'm looking for facts based on your observations of the firm's financial statements and ratios). Consider and evaluate multiple alternatives and their consequences. Draw a well reasoned conclusion, "HOW TO VIDEOS" - Click Here Part 1 - Ratio Calculations Ratios Ratio fermula Teave you a little bit of time Numerators Denominators Ratios for Mystery Company 2016 2017 2018 2015 2019 / Gross Profits Operating profits Earnings Available to SM Fornings Available to SH Earnings Available to SH Earnings Available to SH Sales Sales Sales #of shares outstanding Total Assets Common Stock Equity / / / Profitability Ratios Gross Profit Margin Operating Profit Margin Net Profit Margin Earnings per Share (EPS) Return on Assets (ROA) Return on Equity (ROE) Liquidity Ratios Current Ratio Quick Ratio Debt Ratios Debt to Total Assets Equity Multiplier (FLM) Times Interest Earned Activity Ratios Average Collection Period Accounts Payable Turnover 7 Current Assets Current Assets-Inventory Current Liabilities Current Liebes Total Libes (Debt) Total Assets FISIT Operating income Total Assets Shareholder Equity interesse Accounts Receivable COGS 365 Days AP 7 / / 75/365) Accounts Payable AP Turower Inventory Inventory move Yotal Assets COGS 365 Sales Inventory Turnover Days Inventory Total Asset Turnover Market Ratios Price/Earnings (P/E) MarketBook (MB) Modified DuPont Analysis Net Margin Total Asset Turnover (TAT) ROA Equity Multiplier (FLM) ROE More Price per Sher Market Price per Share 1 2 EPS AOC Book Valur per Shore From above From above Margu "TAT From abowe NOAAM Ratios for Mystery Company 2016 2017 2018 2015 2019 Competitor Averages 2019 49.9% 24.5% 13.7% 2.81 12.4% -0.8% 1.34 1.33 173.3% 2.58 2.97 25.86 23.82 15.33 451.13 0.81 0.80 22.41 0.16 911 o complete these. Part2 Commen im Statement Go tome Statement dance shoutoomalete these Part) - Ratio Analysis Profitability Tech Rate Analyshould houden we only perhes to the day, and went for the rely Liquidity Debt Activity M Medited Dupon Anal Part 4 - Sum it all up Income Statement Balance Sheet Ratio Analysis N 2 3 Uvidity 5 Debt Active 18 19 Market Modified upon Anal 53 Sumit se income Statement Balance Sheet Ratio Analysis + MYSTERY COMPANY INCOME STATEMENT 2015 25,413 15,624 9,789 2,434 12 Months Ended 2016 2017 24,622 22,820 14,417 12,200 10,205 10,620 2,385 2,231 2018 21,025 10,239 10,786 2,200 2019 21,076 9,961 11,115 2,229 . Consolidated Statement of Income - USD ($) shares in Millions $ in Millions Revenue (Sales) Cost of revenue (COGS) Gross profit Sales, General and administrative Other Operating Income/Expense Total operating expenses Operating Income (Also called EBIT) Net Interest Expense Net Investment income Irrigular Income/Expense Other income/Expense Income before takes Provision for income taxes Net income 2,434 7,355 629 191) (63) (17) 6,555 2,026 4,529 2,385 7,820 881 79 (130) (22) 6,866 2,180 4,686 2,231 8,389 914 158 979 (39) 8,573 3,381 5,192 2,200 8,586 977 147 85 (25) 7,816 1,892 5,924 2,229 8,886 1,085 202 30 (15) 8,018 1,993 6,025 Earnings per share Weighted average shares outstanding 4.82 939 5.49 854 6.43 807 7.61 778 7.95 758 118 122 172 175 198 Market Price of Mystery Company's Stock Use this for your Market Ratios Income Statement Analysis Take a look at the income Statement and the Common-Size Income Statement you have just calculated List some of the points of interest below and then talk about a few of them in your ratio analysis and summary: You should be able to use some of this information to back up your time series analysis statements. (Company's performance over the five year period). Points of interest: List your observations from the financial statement here listed a couple to get you started. The Common Size income Statement computes the Gross, Operating and Net Margins This firm's revenues show a very strong upward trend this is very good for the company Income Statement Balance Sheet Ratio Analysis Common Size Income Statement ABOUT THE INCOME STATEMENT unenai 2016 2017 2018 2015 2019 Saarinet Otional The income Statement martes a company's revenues and expenses Based on the equation Revenue Experies. Net Income The income Statement is also known as a Profit and Loss Statement Most income moments cower a los period All Income Statements have parts they may be name oferently but will always give the same normation First Part Grow Profits, we called statement of Earnings The first part always been the coas from the total rewire Second Part Operating also called statement of Operations OBIT tarings before interest and taxes.) The second part always ultracts the operating expenses the group Third PartNet Profit hocaled Statement of income which may includes EPS and the Number of shares Outstanding The third party were outstand for Sparklines are a pul tool in determining trends. They are very easy to do Click in the car where you want the wine Click here at the top of the pracht Find Spares on the toolbar and click the A pop box will appear Cik in the Date or box and the height the fim years of data on your det and click to Once you do this for the first line of the income Statut you can drag the formula down the column a sine for each item on the income Statement The Common Site Income Statement expresses the income Statement a percentage of Yotal Revenue .. Die werything by Total Earnings Available to shareholder text page 5 or under section titled "income utement Chapter 3.1) farning Available to Shareholders. Net Income Preferred 900 Odense Preferred to of the company does not have preferred to arrings Aube to Shareholders Netheme Income Statement Balance Sheet Ratio Analysis MYSTERY COMPANY BALANCE SHEET 2018 866 2015 7,686 1,299 100 559 2017 2,464 1,976 59 828 2,442 51 695 2019 899 2,224 50 385 9,643 37,692 (14,575) 23,118 793 2,516 1,869 28,296 37,939 2016 1,223 1,474 59 565 1,527 4,849 34,443 (13,186) 21,258 726 2,336 1,855 26,175 31,024 77 756 248 533 1,159 695 3,468 25,878 1,817 5,327 36,626 (14,178) 22,448 1,086 2,380 2,563 28,476 33,804 Consolidated Balance Sheet - USD ($) S in Millions Cash and cash equivalents Receivables Inventories Prepaid expenses Other current assets Total current assets Property, plant and equipment Accumulated Depreciation Net property, plant and equipment Equity and other investments Goodwill Other long-term assets Total non-current assets (Long-term) TOTAL ASSETS Current debt and capital lease obligation Accounts payable Interest payable Taxes payable Accrued liabilities Other current liabilities Total current liabilities Long-term debt Deferred taxes liabilities Deferred income/liabilities Payables and accrued expenses Other long-term liabilities Total non-current liabilities(Long-term) Total Liabilities Common stock Additional paid-in capital Retained earnings Treasury stock Accumulated other comprehensive income Total stockholders' equity TOTAL LIABILITIES AND STOCKHOLDER'S EQUITY 4,053 37,194 (14,351) 22,843 1,203 2,332 2,381 28,758 32,881 3,558 52,312 (14,891) 37,421 1,270 2,678 2,584 43,953 47,511 680 988 338 579 1,036 925 279 874 233 464 1,379 1,208 297 482 987 541 1,146 2,950 24,122 1,704 2,891 29,537 1,119 2,074 27,900 30,851 17 6,533 44,594 (41,177) (2,879) 7,088 37,939 2,065 29,760 33,228 17 6,758 46.223 (52,109) (3,093) (2,204) 31,024 2,371 1,154 34,181 37,072 17 7,072 48,325 (56,504) (2,178) (3,268) 33,804 2,974 31,075 1,216 628 2,081 1,096 36,096 39,070 17 7,377 50,487 (61,529) (2,610) (6,258) 32,881 3,621 46,876 1,318 662 2.266 980 52,100 55,721 17 7,655 52.930 (66,329) (2,483) (8,210) 47,511 Balance Sheet Analysis List your observations from the Balance Sheet Analysis here: Income Statement Balance Sheet Ratio Analysis Common-Size Balance Sheet Sparklines Optional 2015 2016 2017 2018 2019 lanan SL Each of the three assignments in this course will have two separate requirements, an Excel spreadsheet (Assignment A) and a quiz (Assignment B). The spreadsheet is worth 40 points and will be due by midnight on Thursday. The quiz is worth 60 points and will be due at midnight on Sunday. The worksheet will prepare you for the quiz. The points earned for the Ratio Analysis Spreadsheet (Assignment 1-A) will be added to the Assignment 1-B quiz grade for a total of 100 points. Instructions for completing the spreadsheet are below. Please complete all 4 parts. This is a very time intensive assignment - don't wait until the last day to begin. Calculate the Ratios (Part 1) Using the financial statements for a mystery company provided on the assignment spreadsheet below, calculate all of the ratios for all five years. When you use excel and link the equations in the first year, you can drag them across and excel will calculate all the other years for you. This is a great time saver! See the help video if you don't know how to do this. Ratio Analysis Spreadsheet a Calculate Common-Size Financial Statements and Complete a Financial Statement Analysis (Part 2) Common size financial statements will help you in your time-series analysis and will give you a better idea of what is going on in the company. Go to the Income Statement and the Balance Sheet tabs and create a common-size statement out to the side of the original ones. (have included a blank format for you). Then complete a financial statement analysis listing a few points of interest. You should also mention some of your findings in your Summary (Part 4). (A financial statement analysis is basically just taking a look at the financial statements to get an overall picture of the company. For instance, by looking at the amount of revenues generated, you can get an idea about the size of a company and by looking at multiple years, you can learn if the revenues are growing or declining. Both are important bits of information about the company.) Analyze and Explain the Ratios (Part 3) On the same spreadsheet, complete an analysis for each ratio category similar to the one on page 97 of the text book. A med Un Common size financial statements will help you in your time series analysis and will give you a better idea of what is going on in the company. Go to the Income Statement and the Balance Sheet tabs and create a common-size statement out to the side of the original ones. (I have included a blank format for you). Then complete a financial statement analysis listing a few points of interest. You should also mention some of your findings in your Summary (Part 4). (A financial statement analysis is basically just taking a look at the financial statements to get an overall picture of the company. For instance, by looking at the amount of revenues generated, you can get an idea about the size of a company and by looking at multiple years, you can learn if the revenues are growing or declining. Both are important bits of information about the company.) Analyze and Explain the Ratios (Part 3) On the same spreadsheet, complete an analysis for each ratio category similar to the one on page 97 of the text book. A ratio analysis includes a trend analysis, an industry comparison and a sentence summarizing your overall view of the company's financial performance in that category. Please be thorough, this is an analysis. You need to discuss each ratio in the category. Summary (Part 4) This is where you summarize all of the information you have attained so far about the company. Using the information you have gained from the financial statement analysis, the common-sized financial statements, and the ratio analysis: state your impression of the overall financial condition of the company and your recommendations of what needs to be accomplished going forward. (I am NOT asking you whether or not you would invest in this company, I'm asking if you were the manager of this company, what you would do.) Use your critical thinking skills here. Back up your statements with data (facts). Thoroughly define the problems. Be aware of bias and fallacious reasoning (Don't just tell me a bunch of things that might or might not be true, I'm looking for facts based on your observations of the firm's financial statements and ratios). Consider and evaluate multiple alternatives and their consequences. Draw a well reasoned conclusion, "HOW TO VIDEOS" - Click Here Part 1 - Ratio Calculations Ratios Ratio fermula Teave you a little bit of time Numerators Denominators Ratios for Mystery Company 2016 2017 2018 2015 2019 / Gross Profits Operating profits Earnings Available to SM Fornings Available to SH Earnings Available to SH Earnings Available to SH Sales Sales Sales #of shares outstanding Total Assets Common Stock Equity / / / Profitability Ratios Gross Profit Margin Operating Profit Margin Net Profit Margin Earnings per Share (EPS) Return on Assets (ROA) Return on Equity (ROE) Liquidity Ratios Current Ratio Quick Ratio Debt Ratios Debt to Total Assets Equity Multiplier (FLM) Times Interest Earned Activity Ratios Average Collection Period Accounts Payable Turnover 7 Current Assets Current Assets-Inventory Current Liabilities Current Liebes Total Libes (Debt) Total Assets FISIT Operating income Total Assets Shareholder Equity interesse Accounts Receivable COGS 365 Days AP 7 / / 75/365) Accounts Payable AP Turower Inventory Inventory move Yotal Assets COGS 365 Sales Inventory Turnover Days Inventory Total Asset Turnover Market Ratios Price/Earnings (P/E) MarketBook (MB) Modified DuPont Analysis Net Margin Total Asset Turnover (TAT) ROA Equity Multiplier (FLM) ROE More Price per Sher Market Price per Share 1 2 EPS AOC Book Valur per Shore From above From above Margu "TAT From abowe NOAAM Ratios for Mystery Company 2016 2017 2018 2015 2019 Competitor Averages 2019 49.9% 24.5% 13.7% 2.81 12.4% -0.8% 1.34 1.33 173.3% 2.58 2.97 25.86 23.82 15.33 451.13 0.81 0.80 22.41 0.16 911 o complete these. Part2 Commen im Statement Go tome Statement dance shoutoomalete these Part) - Ratio Analysis Profitability Tech Rate Analyshould houden we only perhes to the day, and went for the rely Liquidity Debt Activity M Medited Dupon Anal Part 4 - Sum it all up Income Statement Balance Sheet Ratio Analysis N 2 3 Uvidity 5 Debt Active 18 19 Market Modified upon Anal 53 Sumit se income Statement Balance Sheet Ratio Analysis + MYSTERY COMPANY INCOME STATEMENT 2015 25,413 15,624 9,789 2,434 12 Months Ended 2016 2017 24,622 22,820 14,417 12,200 10,205 10,620 2,385 2,231 2018 21,025 10,239 10,786 2,200 2019 21,076 9,961 11,115 2,229 . Consolidated Statement of Income - USD ($) shares in Millions $ in Millions Revenue (Sales) Cost of revenue (COGS) Gross profit Sales, General and administrative Other Operating Income/Expense Total operating expenses Operating Income (Also called EBIT) Net Interest Expense Net Investment income Irrigular Income/Expense Other income/Expense Income before takes Provision for income taxes Net income 2,434 7,355 629 191) (63) (17) 6,555 2,026 4,529 2,385 7,820 881 79 (130) (22) 6,866 2,180 4,686 2,231 8,389 914 158 979 (39) 8,573 3,381 5,192 2,200 8,586 977 147 85 (25) 7,816 1,892 5,924 2,229 8,886 1,085 202 30 (15) 8,018 1,993 6,025 Earnings per share Weighted average shares outstanding 4.82 939 5.49 854 6.43 807 7.61 778 7.95 758 118 122 172 175 198 Market Price of Mystery Company's Stock Use this for your Market Ratios Income Statement Analysis Take a look at the income Statement and the Common-Size Income Statement you have just calculated List some of the points of interest below and then talk about a few of them in your ratio analysis and summary: You should be able to use some of this information to back up your time series analysis statements. (Company's performance over the five year period). Points of interest: List your observations from the financial statement here listed a couple to get you started. The Common Size income Statement computes the Gross, Operating and Net Margins This firm's revenues show a very strong upward trend this is very good for the company Income Statement Balance Sheet Ratio Analysis Common Size Income Statement ABOUT THE INCOME STATEMENT unenai 2016 2017 2018 2015 2019 Saarinet Otional The income Statement martes a company's revenues and expenses Based on the equation Revenue Experies. Net Income The income Statement is also known as a Profit and Loss Statement Most income moments cower a los period All Income Statements have parts they may be name oferently but will always give the same normation First Part Grow Profits, we called statement of Earnings The first part always been the coas from the total rewire Second Part Operating also called statement of Operations OBIT tarings before interest and taxes.) The second part always ultracts the operating expenses the group Third PartNet Profit hocaled Statement of income which may includes EPS and the Number of shares Outstanding The third party were outstand for Sparklines are a pul tool in determining trends. They are very easy to do Click in the car where you want the wine Click here at the top of the pracht Find Spares on the toolbar and click the A pop box will appear Cik in the Date or box and the height the fim years of data on your det and click to Once you do this for the first line of the income Statut you can drag the formula down the column a sine for each item on the income Statement The Common Site Income Statement expresses the income Statement a percentage of Yotal Revenue .. Die werything by Total Earnings Available to shareholder text page 5 or under section titled "income utement Chapter 3.1) farning Available to Shareholders. Net Income Preferred 900 Odense Preferred to of the company does not have preferred to arrings Aube to Shareholders Netheme Income Statement Balance Sheet Ratio Analysis MYSTERY COMPANY BALANCE SHEET 2018 866 2015 7,686 1,299 100 559 2017 2,464 1,976 59 828 2,442 51 695 2019 899 2,224 50 385 9,643 37,692 (14,575) 23,118 793 2,516 1,869 28,296 37,939 2016 1,223 1,474 59 565 1,527 4,849 34,443 (13,186) 21,258 726 2,336 1,855 26,175 31,024 77 756 248 533 1,159 695 3,468 25,878 1,817 5,327 36,626 (14,178) 22,448 1,086 2,380 2,563 28,476 33,804 Consolidated Balance Sheet - USD ($) S in Millions Cash and cash equivalents Receivables Inventories Prepaid expenses Other current assets Total current assets Property, plant and equipment Accumulated Depreciation Net property, plant and equipment Equity and other investments Goodwill Other long-term assets Total non-current assets (Long-term) TOTAL ASSETS Current debt and capital lease obligation Accounts payable Interest payable Taxes payable Accrued liabilities Other current liabilities Total current liabilities Long-term debt Deferred taxes liabilities Deferred income/liabilities Payables and accrued expenses Other long-term liabilities Total non-current liabilities(Long-term) Total Liabilities Common stock Additional paid-in capital Retained earnings Treasury stock Accumulated other comprehensive income Total stockholders' equity TOTAL LIABILITIES AND STOCKHOLDER'S EQUITY 4,053 37,194 (14,351) 22,843 1,203 2,332 2,381 28,758 32,881 3,558 52,312 (14,891) 37,421 1,270 2,678 2,584 43,953 47,511 680 988 338 579 1,036 925 279 874 233 464 1,379 1,208 297 482 987 541 1,146 2,950 24,122 1,704 2,891 29,537 1,119 2,074 27,900 30,851 17 6,533 44,594 (41,177) (2,879) 7,088 37,939 2,065 29,760 33,228 17 6,758 46.223 (52,109) (3,093) (2,204) 31,024 2,371 1,154 34,181 37,072 17 7,072 48,325 (56,504) (2,178) (3,268) 33,804 2,974 31,075 1,216 628 2,081 1,096 36,096 39,070 17 7,377 50,487 (61,529) (2,610) (6,258) 32,881 3,621 46,876 1,318 662 2.266 980 52,100 55,721 17 7,655 52.930 (66,329) (2,483) (8,210) 47,511 Balance Sheet Analysis List your observations from the Balance Sheet Analysis here: Income Statement Balance Sheet Ratio Analysis Common-Size Balance Sheet Sparklines Optional 2015 2016 2017 2018 2019 lanan SL