

Question: ( earning Objectives Download the data file and follow the instruction below. Submit your excel sheet saved as LastnameFirstInitial 2 . xslx ( i
earning Objectives
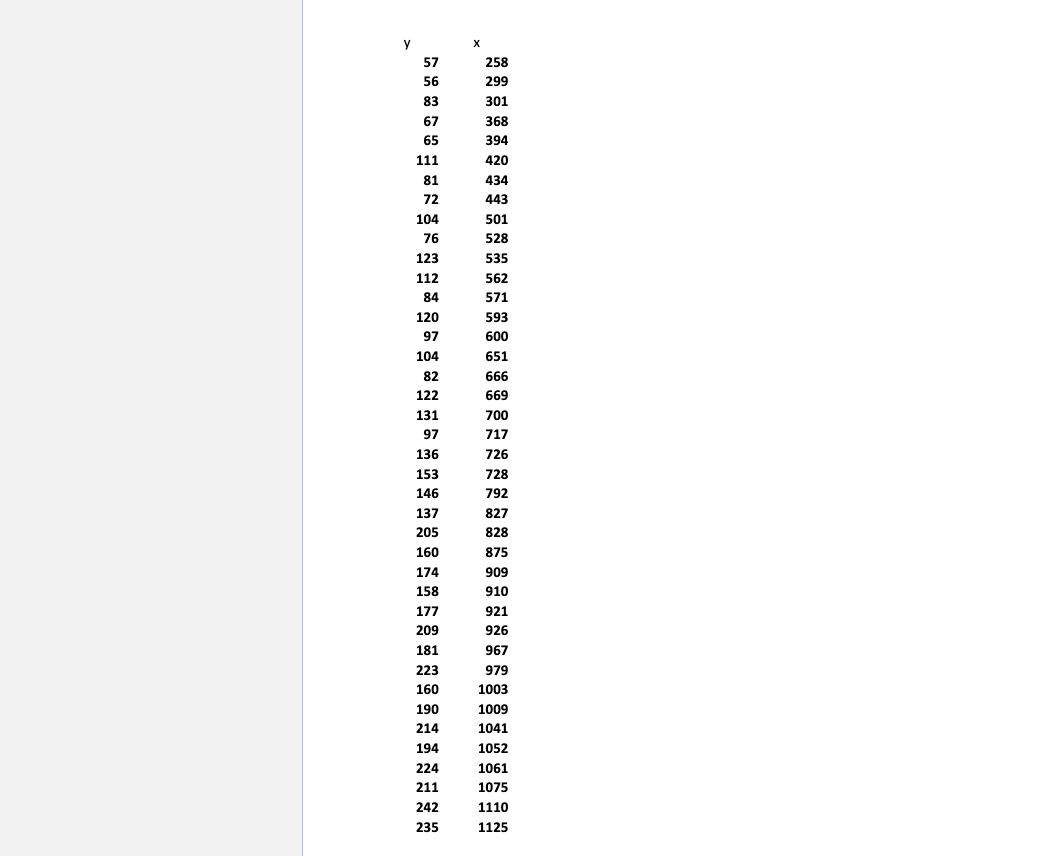
Download the data file and follow the instruction below.
Submit your excel sheet saved as "LastnameFirstInitialxslxie "AsciSxslx by Thursday pm
o Instructions
Download the data and insert them in a new workbook.
Save as "LastnameFirstInitialxslxuse F
Align data to Center and change data titles to Food Expenditure $ Weekly Income $
Find Descriptive Statistics using Data Analysis Toolbar.
Estimate Moving Average Interval for each variable using Data Analysis Toolbar.
Create the moving average carts using Chart Output option in the dialog box Check the boxes for "Chart Output and Standard Errors"
Name the worksheet tab as "Moving averages."
Open a new worksheet tab and copypaste data to the new tab.
Plot the data using X Y Scatter, insert chart title and axis titles xWeekly Income $ Food Expenditure $ Insert trend line with its equation and
Insert Linear Trend Line to Predicted Y Insert the equation to the chart.
Create a new worksheet tab called "Predicted Food Expenditure"
Calculate predicted food expenditure when income is $ using the regression table in your new tab.
Save your workbook and submit it to Canvas
all tablesgraphs should be formatted nicely.!!!!
Hello, Can yuou please help me do this. Can you please do it in an excel sheet that I can access. I need to submit this very soon so i just need it done and complete please. Thanks!
Step by Step Solution
There are 3 Steps involved in it
1 Expert Approved Answer
Step: 1 Unlock

Question Has Been Solved by an Expert!
Get step-by-step solutions from verified subject matter experts
Step: 2 Unlock
Step: 3 Unlock