Question
e.Based on the table below, the Inventory Turnover ratio is: 1.5 times 0.67% 0.67 times 1.5% .47 times f.Based on the table below, the Market

e.Based on the table below, the Inventory Turnover ratio is:
1.5 times
0.67%
0.67 times
1.5%
.47 times
f.Based on the table below, the Market to Book ratio is:
0.15
0.90
2.45
6.57
0.51
g.Based on the table below, the Net Profit margin is:
16.2%
60%
37%
13.7%
50%
h.Based on the table below, the Return on Equity is:
0.162%
16.2%
8.77%
13.7%
3.81%
i.Based on the table below, the Times Interest Earned ratio is:
3.7
0.62
1.5
0.27
2.7
j.Based on the table below, the Total Asset Turnover ratio is:
4.25 times
4.25 times
2.35 times
0.24 times
1.57 times
k.Based on the table below, the Total Debt to Total Asset ratio is:
0.76
0.59
1.31
76.4
.35
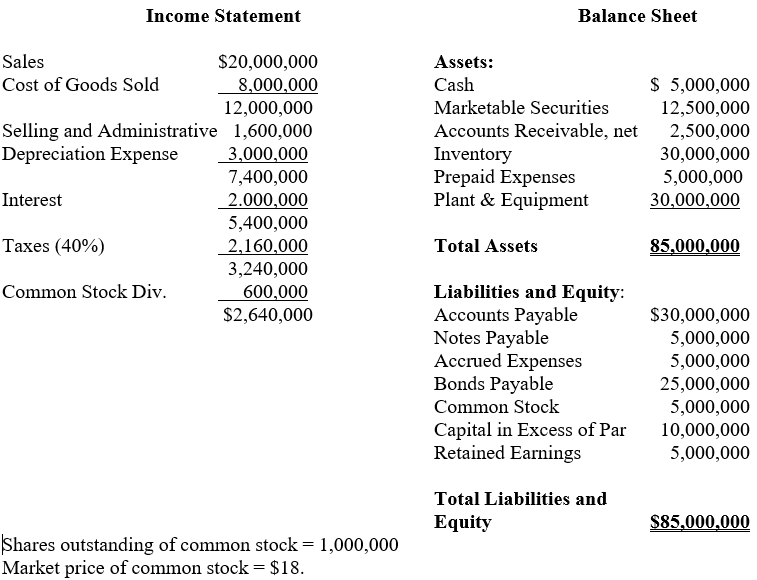
Income Statement Balance Sheet Sales $20,000,000 Cost of Goods Sold 8,000,000 12,000,000 Selling and Administrative 1,600,000 Depreciation Expense 3,000,000 7,400,000 Interest 2.000,000 5,400,000 Taxes (40%) 2,160,000 3,240,000 Common Stock Div. 600,000 $2,640,000 Assets: Cash Marketable Securities Accounts Receivable, net Inventory Prepaid Expenses Plant & Equipment $ 5,000,000 12,500,000 2,500,000 30,000,000 5,000,000 30,000,000 Total Assets 85,000,000 Liabilities and Equity: Accounts Payable Notes Payable Accrued Expenses Bonds Payable Common Stock Capital in Excess of Par Retained Earnings $30,000,000 5,000,000 5,000,000 25,000,000 5,000,000 10,000,000 5,000,000 Total Liabilities and Equity $85,000,000 Shares outstanding of common stock = 1,000,000 Market price of common stock = $18Step by Step Solution
There are 3 Steps involved in it
Step: 1

Get Instant Access to Expert-Tailored Solutions
See step-by-step solutions with expert insights and AI powered tools for academic success
Step: 2

Step: 3

Ace Your Homework with AI
Get the answers you need in no time with our AI-driven, step-by-step assistance
Get Started


