

Answered step by step
Verified Expert Solution
Question
1 Approved Answer
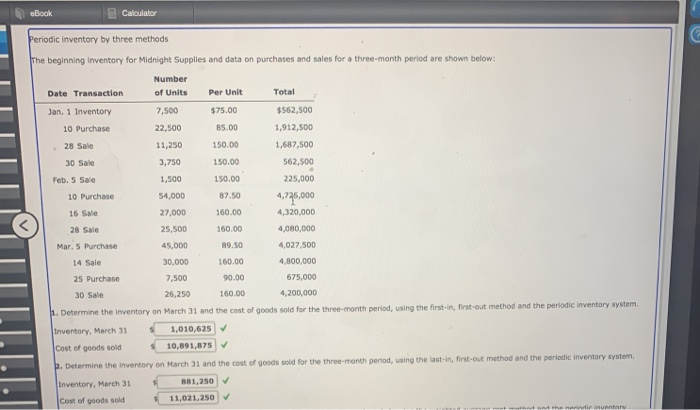
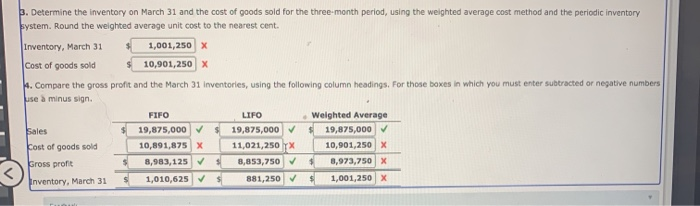
eBook Calculator 4,725.000 Periodic inventory by three methods The beginning inventory for Midnight Supplies and data on purchases and sales for a three-month period are
Step by Step Solution
There are 3 Steps involved in it
Step: 1

Get Instant Access to Expert-Tailored Solutions
See step-by-step solutions with expert insights and AI powered tools for academic success
Step: 2

Step: 3
Ace Your Homework with AI
Get the answers you need in no time with our AI-driven, step-by-step assistance
Get Started
Advanced Accounting
Authors: Debra JeterJames Reeve, Jonathan Duchac, Horace Brock, Paul Chaney
4th Edition
0470506989, 978-0470506981