Answered step by step
Verified Expert Solution
Question
1 Approved Answer
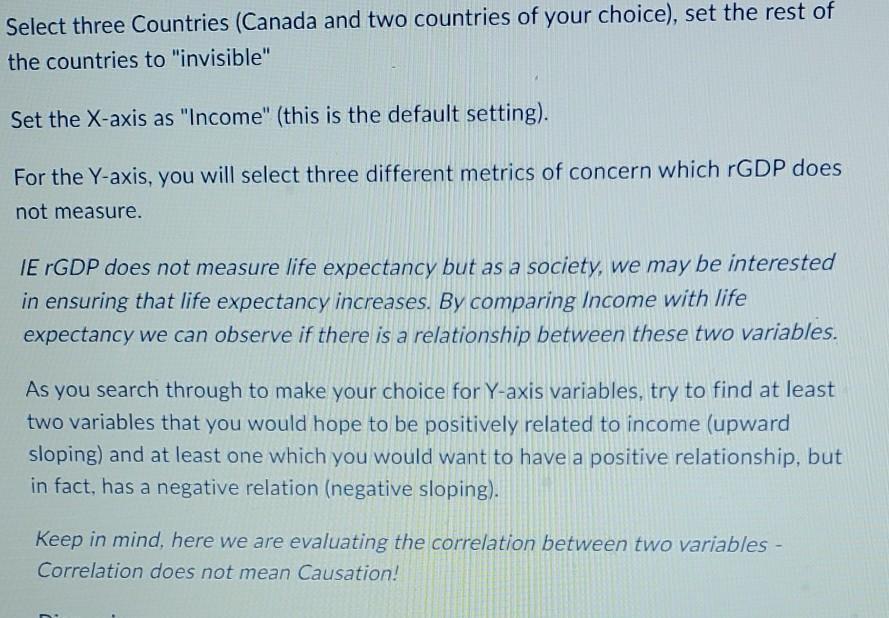
Select three Countries (Canada and two countries of your choice), set the rest of the countries to invisible Set the X-axis as Income (this
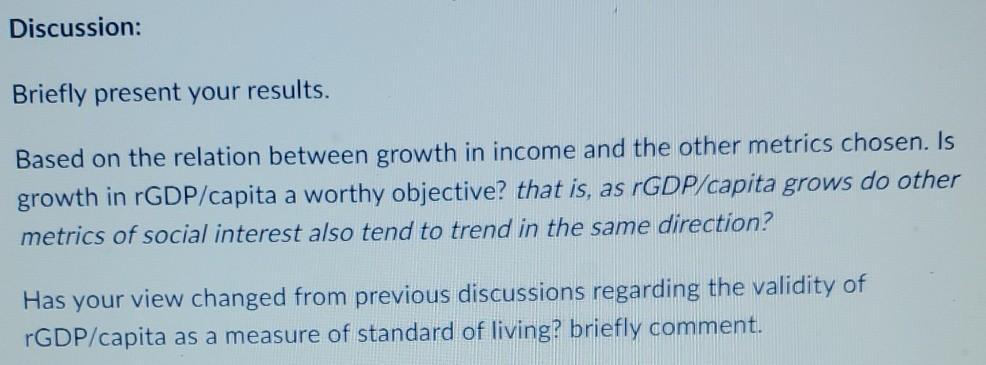
Select three Countries (Canada and two countries of your choice), set the rest of the countries to "invisible" Set the X-axis as "Income" (this is the default setting). For the Y-axis, you will select three different metrics of concern which rGDP does not measure. IE rGDP does not measure life expectancy but as a society, we may be interested in ensuring that life expectancy increases. By comparing Income with life expectancy we can observe if there is a relationship between these two variables. As you search through to make your choice for Y-axis variables, try to find at least two variables that you would hope to be positively related to income (upward sloping) and at least one which you would want to have a positive relationship, but in fact, has a negative relation (negative sloping). Keep in mind, here we are evaluating the correlation between two variables - Correlation does not mean Causation! Discussion: Briefly present your results. Based on the relation between growth in income and the other metrics chosen. Is growth in rGDP/capita a worthy objective? that is, as rGDP/capita grows do other metrics of social interest also tend to trend in the same direction? Has your view changed from previous discussions regarding the validity of rGDP/capita as a measure of standard of living? briefly comment.
Step by Step Solution
★★★★★
3.51 Rating (161 Votes )
There are 3 Steps involved in it
Step: 1
in the above graphs we can see when the the income increases the life expectancy also increases in a...
Get Instant Access to Expert-Tailored Solutions
See step-by-step solutions with expert insights and AI powered tools for academic success
Step: 2

Step: 3

Ace Your Homework with AI
Get the answers you need in no time with our AI-driven, step-by-step assistance
Get Started


