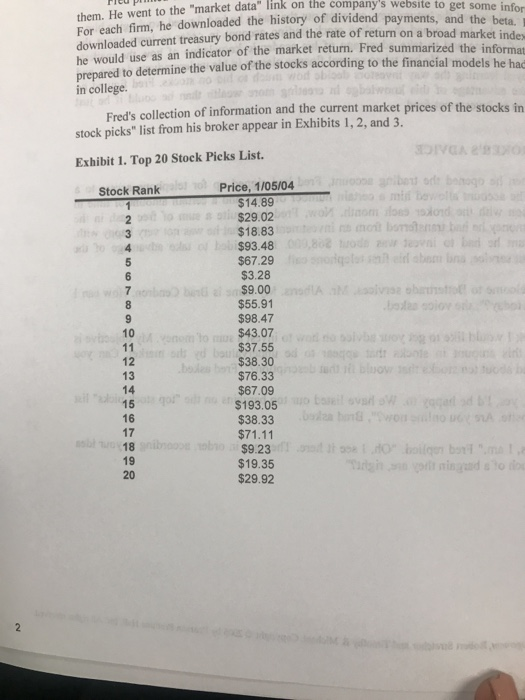
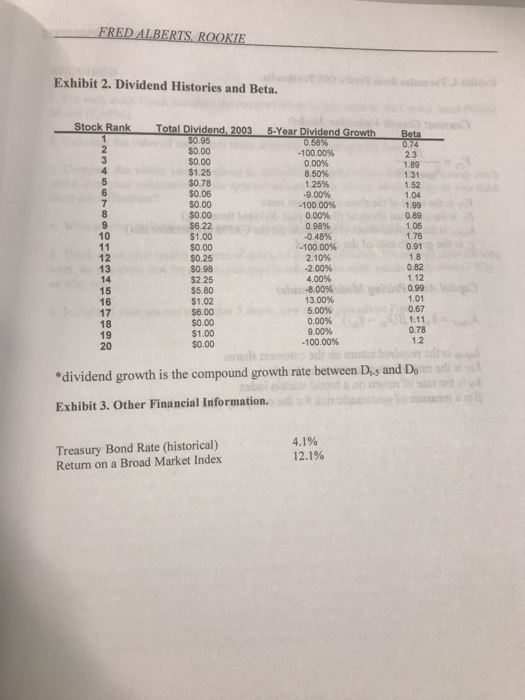
eent to the "market data" link on the company's website to get some infor For each firm, he downloaded the history of dividend payments, and the beta downloaded current treasury bond rates and the rate of return on a broad he would use as an indicator of the market return. Fred summarized the info prepared to determine the value of the stocks according to the financial models he in college. market index rmat hac prices of the stocks in Fred's collection of information and the current market stock picks" list from his broker appear in Exhibits 1,2, and 3. Exhibit 1. Top 20 Stock Picks List. Price, 1/05/04 $14.89 $29.02 $18.83 $93.48 $67.29 $3.28 $9.00 $55.91 $98.47 $43.07 $37.55 $38.30 $76.33 $67.09 $193.05 $38.33 $71.11 $9.23 $19.35 $29.92 Stock Rank 10 12 13 14 15 16 17 18 19 20 FRED ALBERTS ROOKIE Exhibit 2. Dividend Histories and Beta. Stock Rank Total Dividend, 2003 5-Year Dividend Growth Beta $0.95 $0.00 $0.00 $1.25 $0.78 $0.06 $0.00 $0.00 $6.22 $1.00 $0.00 $0.25 $0.98 $2.25 $5.80 $1.02 $6.00 $0.00 $1.00 $0.00 -100.00% 0.00% 8.50% 1.25% -9.00% 100.00% 0.00% 0 98% -0 48% -100.00% 2.10% -2.00% 1.89 1.52 1.99 0.89 1.06 1.76 0.91 -8.00% 13.00% 5.00% 0.00% 9.00% -100 00% 0.99 0.67 1.11 0.78 1.2 dividend growth is the compound growth rate between Dis and Don Exhibit 3. Other Financial Information. Treasury Bond Rate (historical) Return on a Broad Market Index 12.1% RED ALBERTN ROOKIE REQUIRED t. For each stock listed, calculate the required return as indicated by the Capital Asset Pricing Model (CAPM) 2. Calculate the value of each stock share using the constant growth formula 3. Compare the values you calculated to each of the market prices for the top twenty stock picks. Are your calculations close approximations of the market prices? Why do you think there are differences? 4. What are the implications of your analysis to Fred's choice of stocks? S. Think about your results in terms of claims of market efficiency. On average, over the long term, do you think that the models you used to calculate the stock values really works? Why or why not? 6. In light of your answer in number S above, how would you advise Fred? Lonty need help with 10 eent to the "market data" link on the company's website to get some infor For each firm, he downloaded the history of dividend payments, and the beta downloaded current treasury bond rates and the rate of return on a broad he would use as an indicator of the market return. Fred summarized the info prepared to determine the value of the stocks according to the financial models he in college. market index rmat hac prices of the stocks in Fred's collection of information and the current market stock picks" list from his broker appear in Exhibits 1,2, and 3. Exhibit 1. Top 20 Stock Picks List. Price, 1/05/04 $14.89 $29.02 $18.83 $93.48 $67.29 $3.28 $9.00 $55.91 $98.47 $43.07 $37.55 $38.30 $76.33 $67.09 $193.05 $38.33 $71.11 $9.23 $19.35 $29.92 Stock Rank 10 12 13 14 15 16 17 18 19 20 FRED ALBERTS ROOKIE Exhibit 2. Dividend Histories and Beta. Stock Rank Total Dividend, 2003 5-Year Dividend Growth Beta $0.95 $0.00 $0.00 $1.25 $0.78 $0.06 $0.00 $0.00 $6.22 $1.00 $0.00 $0.25 $0.98 $2.25 $5.80 $1.02 $6.00 $0.00 $1.00 $0.00 -100.00% 0.00% 8.50% 1.25% -9.00% 100.00% 0.00% 0 98% -0 48% -100.00% 2.10% -2.00% 1.89 1.52 1.99 0.89 1.06 1.76 0.91 -8.00% 13.00% 5.00% 0.00% 9.00% -100 00% 0.99 0.67 1.11 0.78 1.2 dividend growth is the compound growth rate between Dis and Don Exhibit 3. Other Financial Information. Treasury Bond Rate (historical) Return on a Broad Market Index 12.1% RED ALBERTN ROOKIE REQUIRED t. For each stock listed, calculate the required return as indicated by the Capital Asset Pricing Model (CAPM) 2. Calculate the value of each stock share using the constant growth formula 3. Compare the values you calculated to each of the market prices for the top twenty stock picks. Are your calculations close approximations of the market prices? Why do you think there are differences? 4. What are the implications of your analysis to Fred's choice of stocks? S. Think about your results in terms of claims of market efficiency. On average, over the long term, do you think that the models you used to calculate the stock values really works? Why or why not? 6. In light of your answer in number S above, how would you advise Fred? Lonty need help with 10